Assessment
Western welfare states face a substantial fiscal squeeze, but its severity varies. The strongest common pressures are ageing, healthcare and care costs, recurring funding gaps, and the interest paid on accumulated debt. Britain also has a marked increase in health-related benefit spending. The political difficulty is that both the recipients of benefits and the people asked to finance them are large, organized constituencies. Reform is difficult and sometimes reversed; it is demonstrably possible. The evidence supports a warning about delayed adjustment, not a prediction that every Western country is approaching an unavoidable collapse.
Starting sources: Richard Hanania, “There Are Now Too Many Millionaires to Attack”, 12 October 2026; Max Colchester and David Luhnow, “The Welfare State Is Crushing Britain”, 11 October 2026, corrected 12 October. The complete supplied WSJ PDF was inspected. Only Hanania’s public opening was accessible; the gated remainder is not represented as read. 1 2
Coverage: twelve selected Western countries in the comparable fiscal charts: Australia, Canada, Denmark, Finland, France, Germany, Italy, the Netherlands, Spain, Sweden, the United Kingdom, and the United States. EU-wide evidence complements this sample. These are selected cases, not an exhaustive definition of “the West.” Figures use explicitly identified vintages; an April or February forecast is not an October market snapshot.
Reading map: What the two articles are arguing · What counts as welfare · How the countries compare · Britain and the disability-benefit controversy · Where the pressure is headed · Why adjustment is politically difficult · What the studies actually establish · Reforms that could survive politically · Evidence and calculation record
What the two articles are arguing
Hanania: the financing coalition is larger than the slogan suggests
In the accessible introduction, Hanania argues that a large welfare-state expansion cannot be financed simply by targeting billionaires. It would reach a broader class of millionaires, successful business owners, and high-earning professionals, whose numbers and social position make them harder political targets. This is an argument about the gap between a convenient political villain and the breadth of the tax base a continuing spending commitment requires. It does not, in the inspected excerpt, provide a specified program, revenue estimate, or measured voting response. 1
Assessment: distinguish three propositions. First, a recurring spending program needs recurring finance; adding up wealthy people’s assets is not an estimate of annual tax revenue. Second, expensive welfare states generally use taxes that reach well beyond billionaires. Third, the size of an affluent constituency may affect electoral strategy. The first is budget arithmetic. The second can be checked against actual tax systems. The third is a political hypothesis that requires evidence about preferences, turnout, organization, and coalition formation. A millionaire count alone establishes none of those behaviors.
Net worth, income, and liquid taxable resources also differ. A household with a valuable home and retirement account has a different capacity to pay a large new annual tax from someone receiving a similar sum as annual income. Inflation and house prices can move households across a nominal “millionaire” threshold without a comparable improvement in their disposable income. Those distinctions make the label a poor stand-alone measure of a government’s revenue capacity.
An expansion of public health insurance is another special case: new government expenditure may replace existing premiums or household payments. Its gross public cost and its net additional cost to society are different questions. Conversely, moving a public expense into private insurance can reduce the recorded government budget while leaving the underlying cost high. These accounting choices matter when evaluating Hanania’s broader premise about what an affluent economy can or cannot finance.
The WSJ: rapid benefit growth meets weak fiscal and political capacity
The WSJ develops its argument through Britain’s sickness and disability system. It reports rising caseloads, more psychiatric claims, financial incentives to claim, the Motability vehicle-leasing program, and difficulty returning recipients to employment. Its opening fraud case supplies a vivid example of abuse. Interviews with families and advice charities also describe genuine disability, weak job prospects, treatment shortages, and the protection benefits provide. The wider argument connects benefit growth with weak economic growth, debt interest, tax resistance, and the retreat from proposed eligibility restrictions. 2 (PDF pp. 1–14)
The article’s strongest concern is a possible feedback loop: a weak labour market and poor health increase claims; a larger benefit bill and smaller tax base tighten the budget; unpopular reforms are delayed; the resulting borrowing and taxes can further narrow policy choices. Its most contestable steps concern how much of the increase is abuse rather than illness or institutional change, whether receipt itself causes withdrawal from work, and whether recent reversals prove reform generally impossible.
Assessment: the fiscal pressure deserves serious attention. The reporting is not a representative prevalence study of fraud, a causal employment study, or a harmonized comparison of every Western disability system. The general claim should be tested against official spending definitions, credible causal studies, and implemented reforms. The note therefore retains the article’s concern while qualifying those larger inferences.
What counts as welfare
Much disagreement begins with different definitions. In American conversation, “welfare” often means means-tested support for people on low incomes. European social-expenditure totals commonly include old-age pensions and healthcare, which benefit broad sections of society. British budget tables use “welfare” for cash benefits and tax credits, including the state pension, while recording NHS spending elsewhere.
| Measure | Includes | Best use | Main comparison hazard |
|---|---|---|---|
| OECD gross public social expenditure, SOCX | Public social programs, including pensions, health, family support, incapacity and unemployment | Comparable scale of public social provision | Excludes private social spending and does not subtract benefit taxation |
| OECD net total social expenditure | Public and qualifying private social spending, adjusted for taxes and specified tax breaks | Broader comparison of resources reaching social provision | A high figure is not proof of generous benefits or efficient delivery |
| Eurostat ESSPROS benefits | Social protection across reporting schemes, including old age, sickness/health and other risks | EU composition and trends within that system | Not identical to OECD public social expenditure |
| OBR UK welfare | Cash benefits and tax credits, including pensioner spending | British benefit-budget analysis | NHS expenditure is outside this total |
| General-government expenditure | All government functions and levels | Whole-budget financing and debt comparisons | Includes defence, infrastructure, administration and interest, not just welfare |
| US federal outlays | Federal spending under CBO’s budget conventions | American federal outlook | State/local expenditure is outside this measure |
Sources and classification details: OECD SOCX, Eurostat ESSPROS, OBR Table 4.6, IMF statistical conventions, and CBO’s categories of federal outlays. 3 4 5 6 7
Four additional distinctions prevent misleading charts. Nominal spending can grow because of inflation; real spending adjusts for purchasing power; spending as a share of GDP measures the economy’s burden; real spending per person adjusts for both prices and population. A recession can raise spending/GDP through a falling denominator, while a recovery can lower it without reducing cash spending. A forecast should have a visibly different style from historical data. A government’s gross debt also differs from debt after deducting financial assets. Future pension promises are not fully captured by today’s recorded bond debt.
The OECD describes a pandemic-related increase in average public social spending from roughly 20% of GDP in 2019 to around 23% in 2020, followed by a retreat. This alone defeats the claim that the ratio rises every year. Long-run expansion, temporary emergency spending, and renewed ageing pressure can coexist. 3
Public spending alone misses substantial private costs
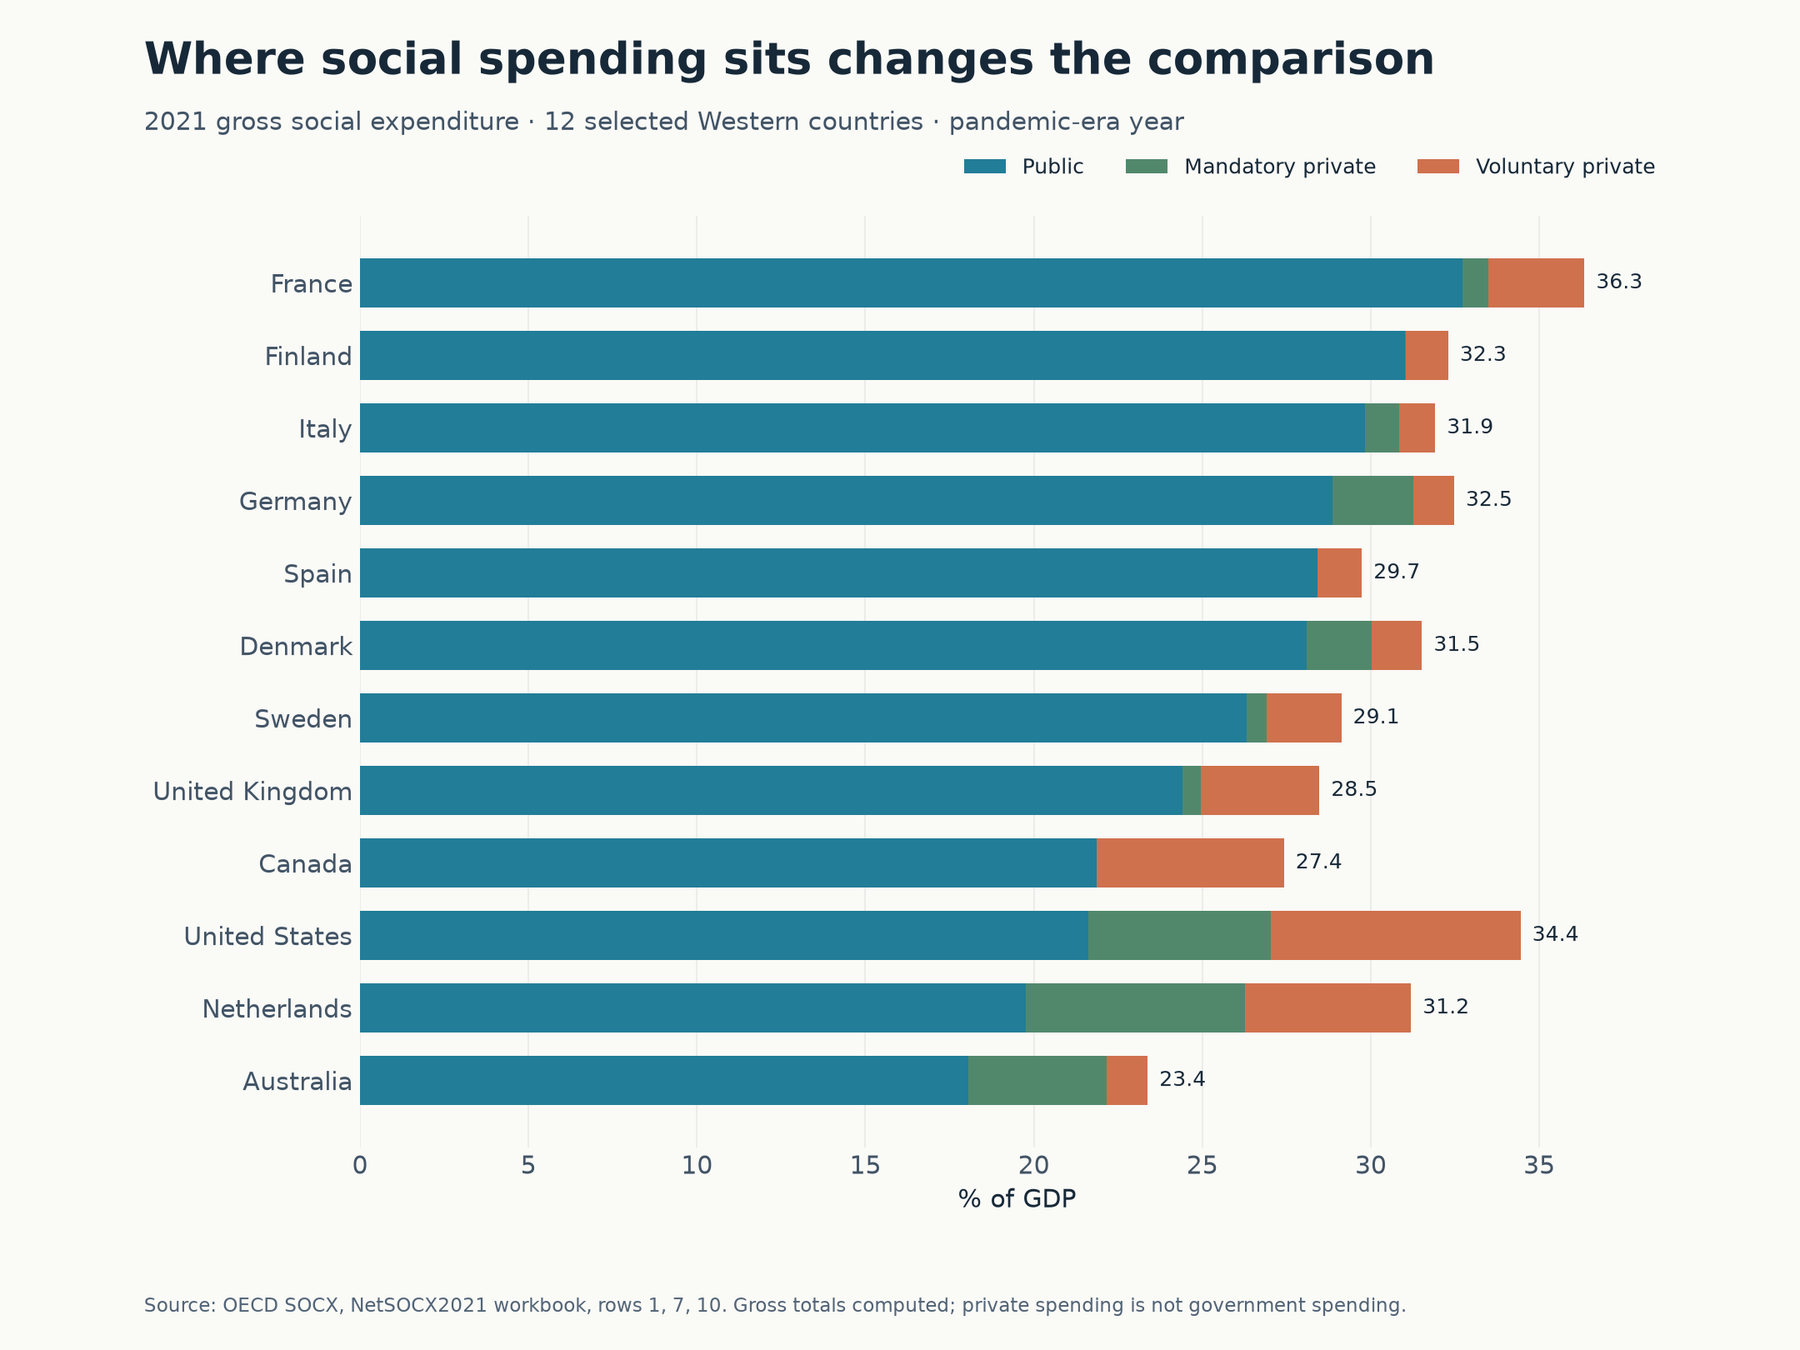
Figure 1. Own chart from the OECD’s 2021 gross public, mandatory private, and voluntary private social-expenditure table. The stacked private components are not government expenditure. The common year is pandemic-affected; it is used to compare accounting structures, not to describe current 2026 levels. 8
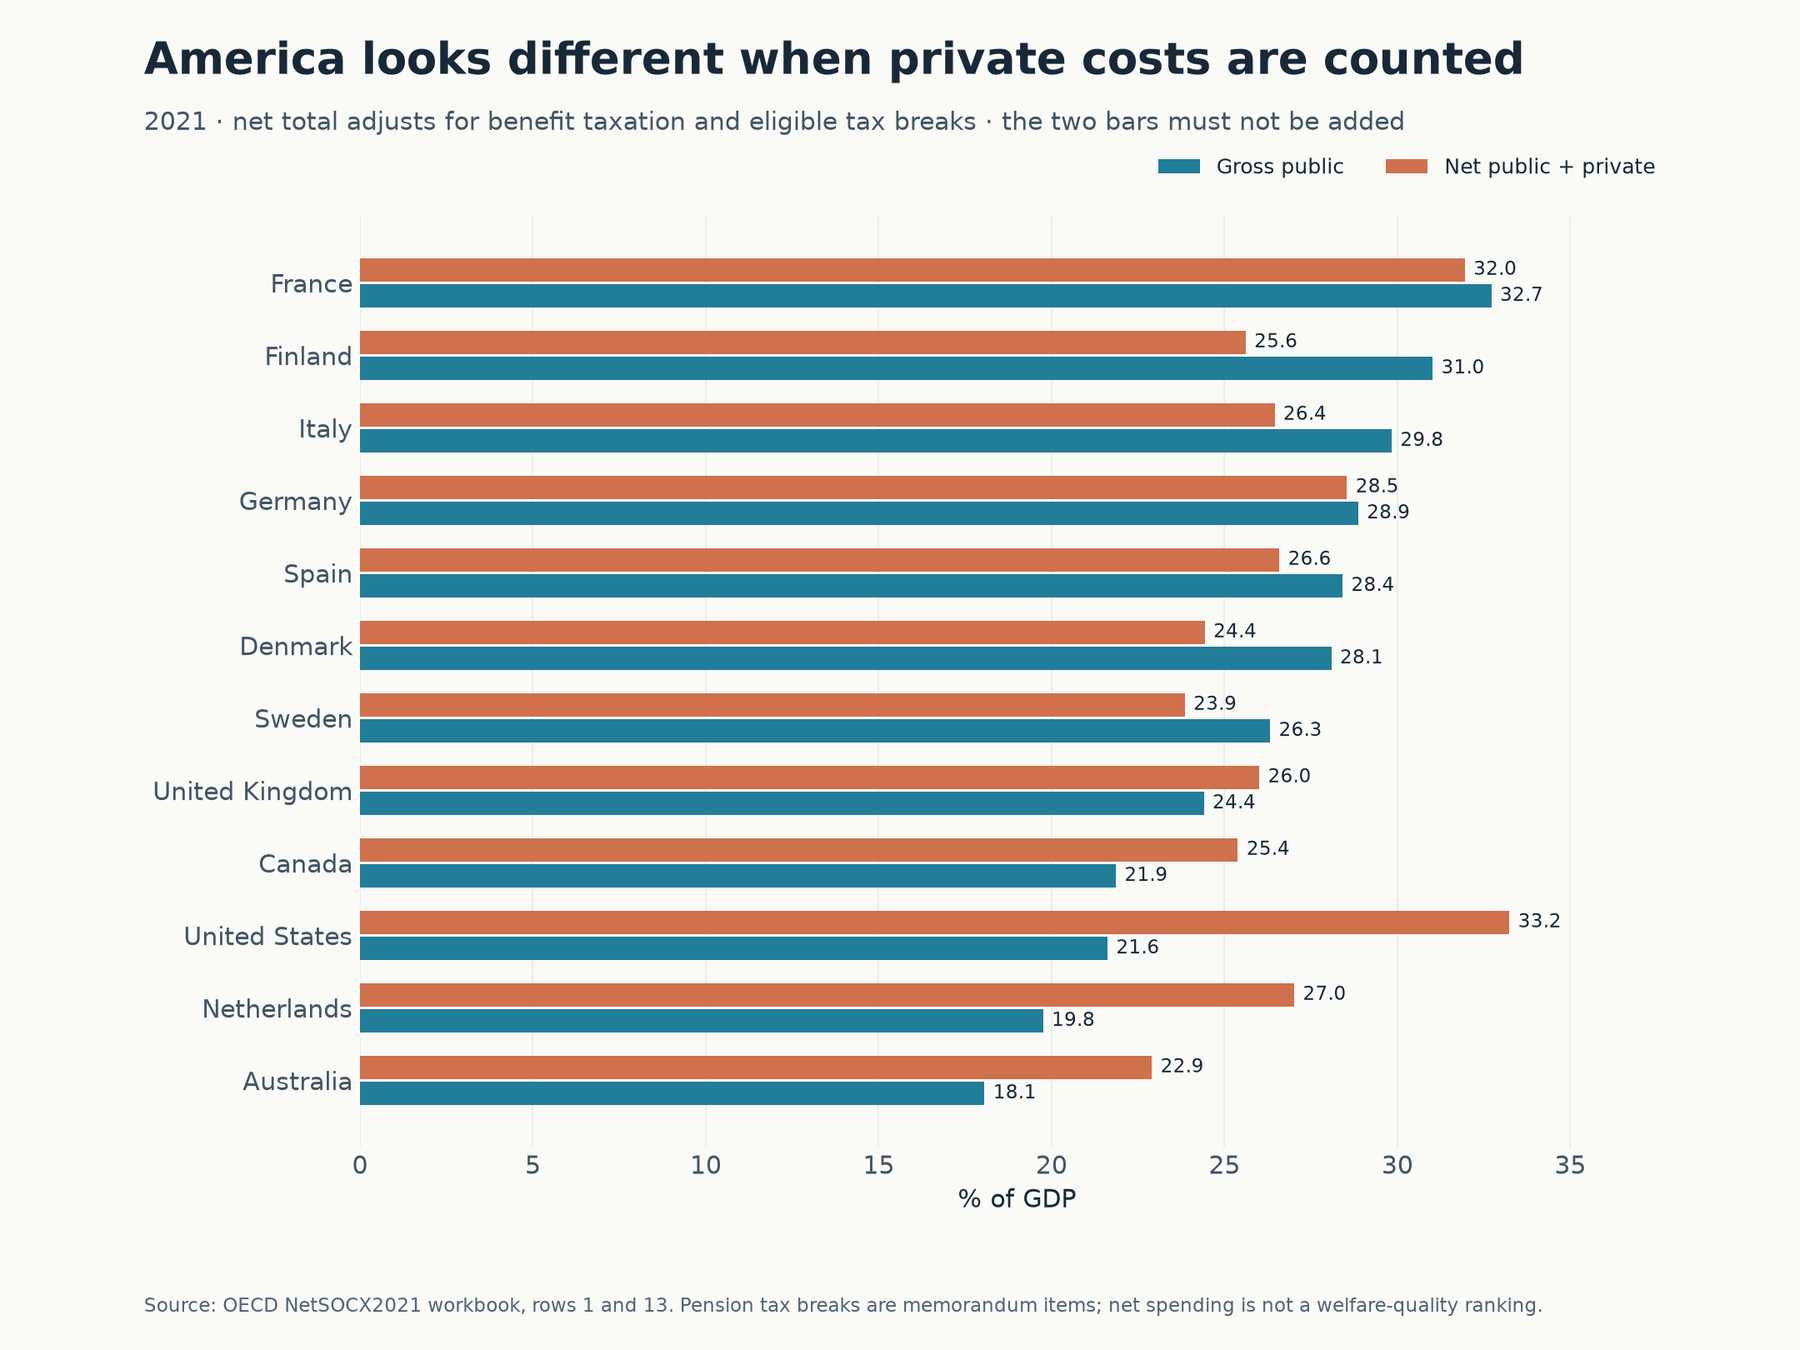
Figure 2. Own chart from the same workbook. The two bars compare different measures and must not be added. Net total deducts relevant taxes and avoids double counting specified tax breaks. Pension tax concessions remain memorandum items rather than a complete component of the total. 8
The United States records gross public social expenditure of about 21.6% of GDP in this table, compared with 32.7% in France. But net public-plus-private expenditure is approximately 33.2% in the US and 32.0% in France. The Netherlands also moves upward when private provision is included. These are direct dataset comparisons, not an efficiency ranking. American medical prices, private insurance, and the structure of retirement provision can absorb substantial resources without producing the same coverage or distribution as European systems.
Interpretation: “Americans pay less for welfare” is not interchangeable with “the American government spends less on social programs.” Households, employers, and private insurers can pay instead. The policy question is how much protection a system supplies for the resources used, how it distributes costs, and whether its public commitments are financed. The UK SOCX country note also warns of a 2019 series break and possible underreporting of local-government spending; this dossier does not draw a smooth UK SOCX trend through that break. 9
How the countries compare
Whole budgets: expenditure has to be matched by revenue
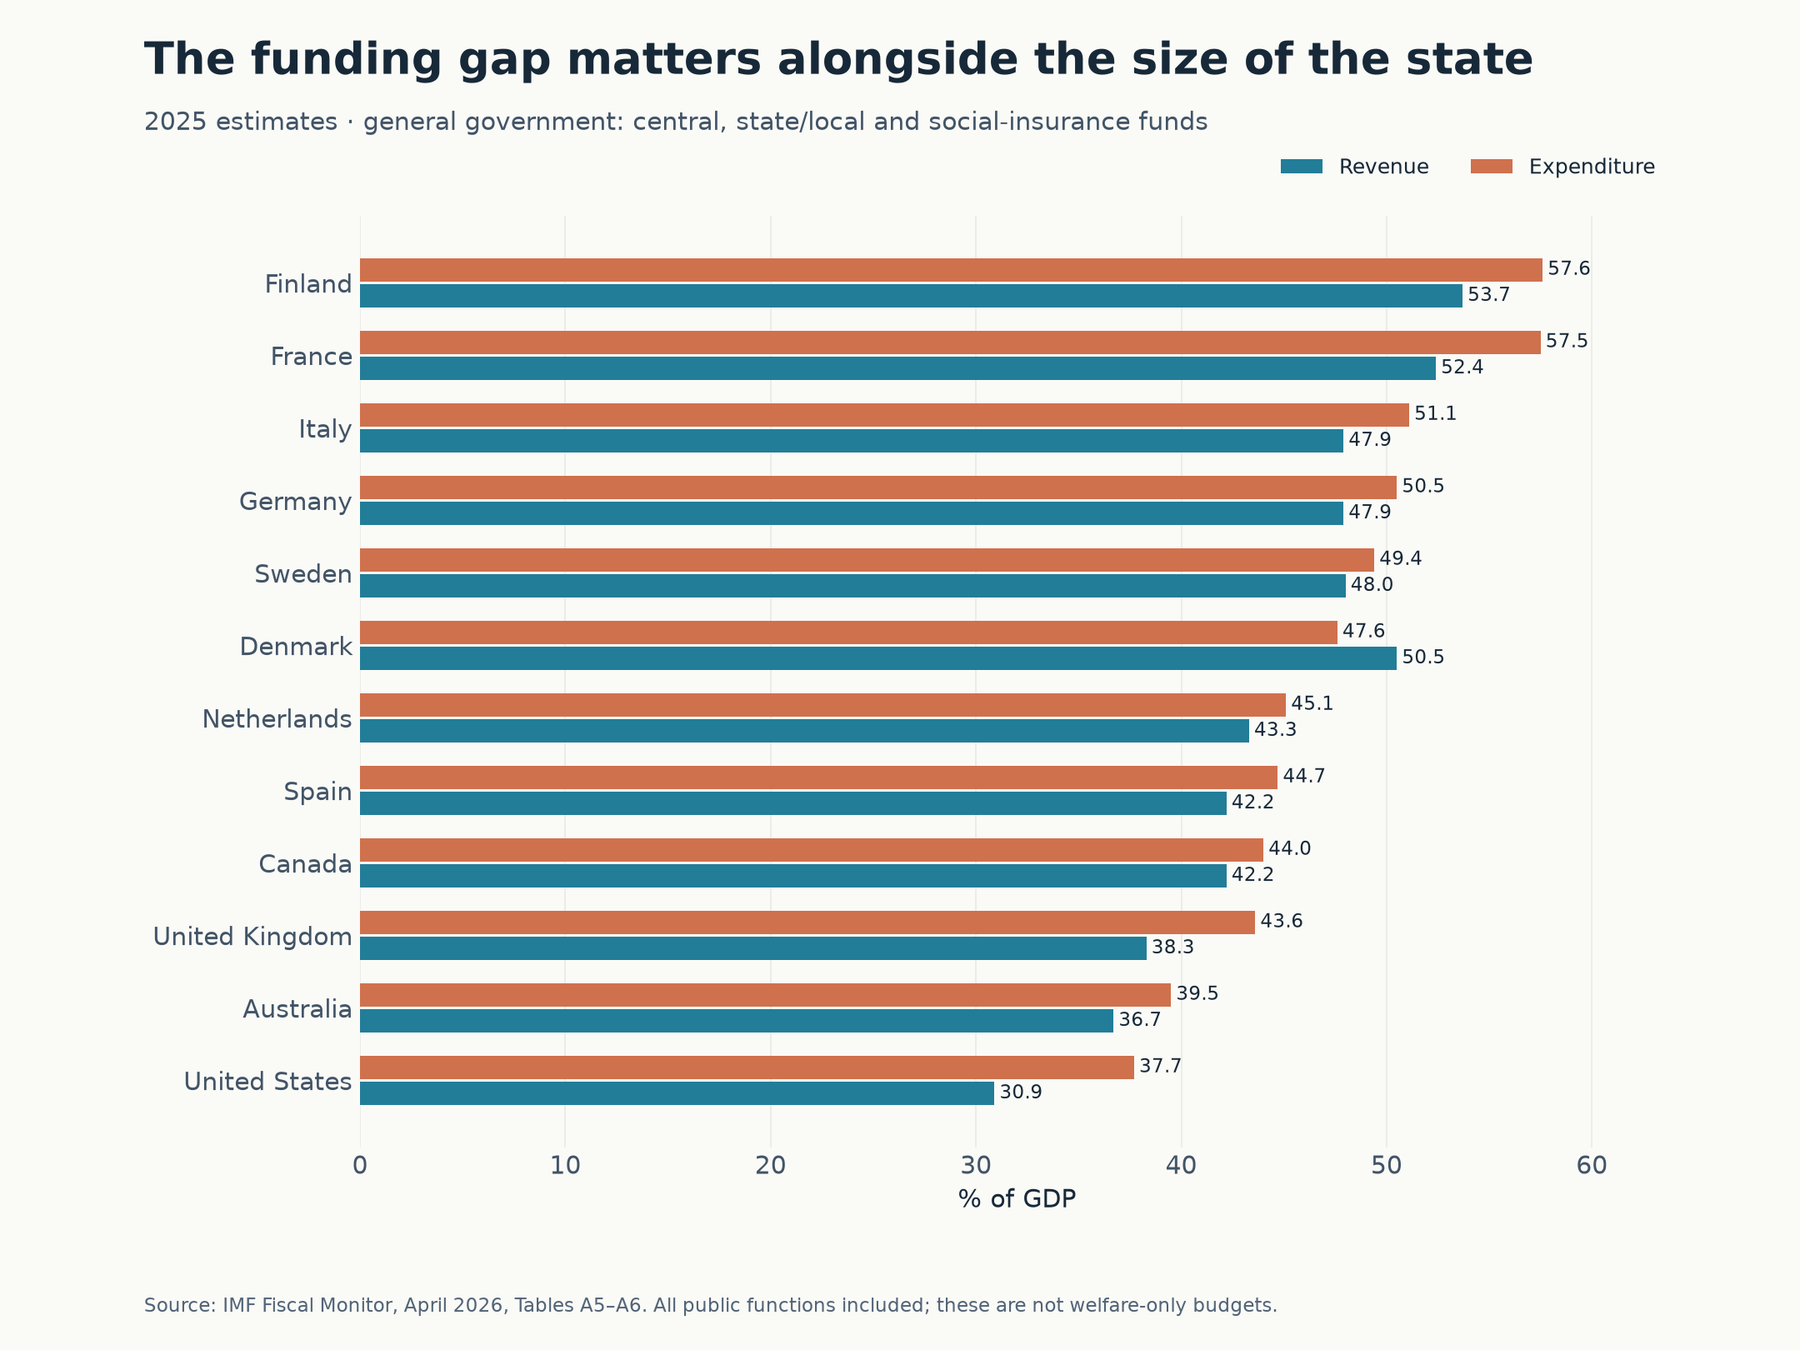
Figure 3. Own comparison using IMF Fiscal Monitor, April 2026, Tables A5–A6. General-government revenue and expenditure, both as percentages of GDP; 2025 estimates. Revenue includes non-tax receipts. These are whole budgets. 6
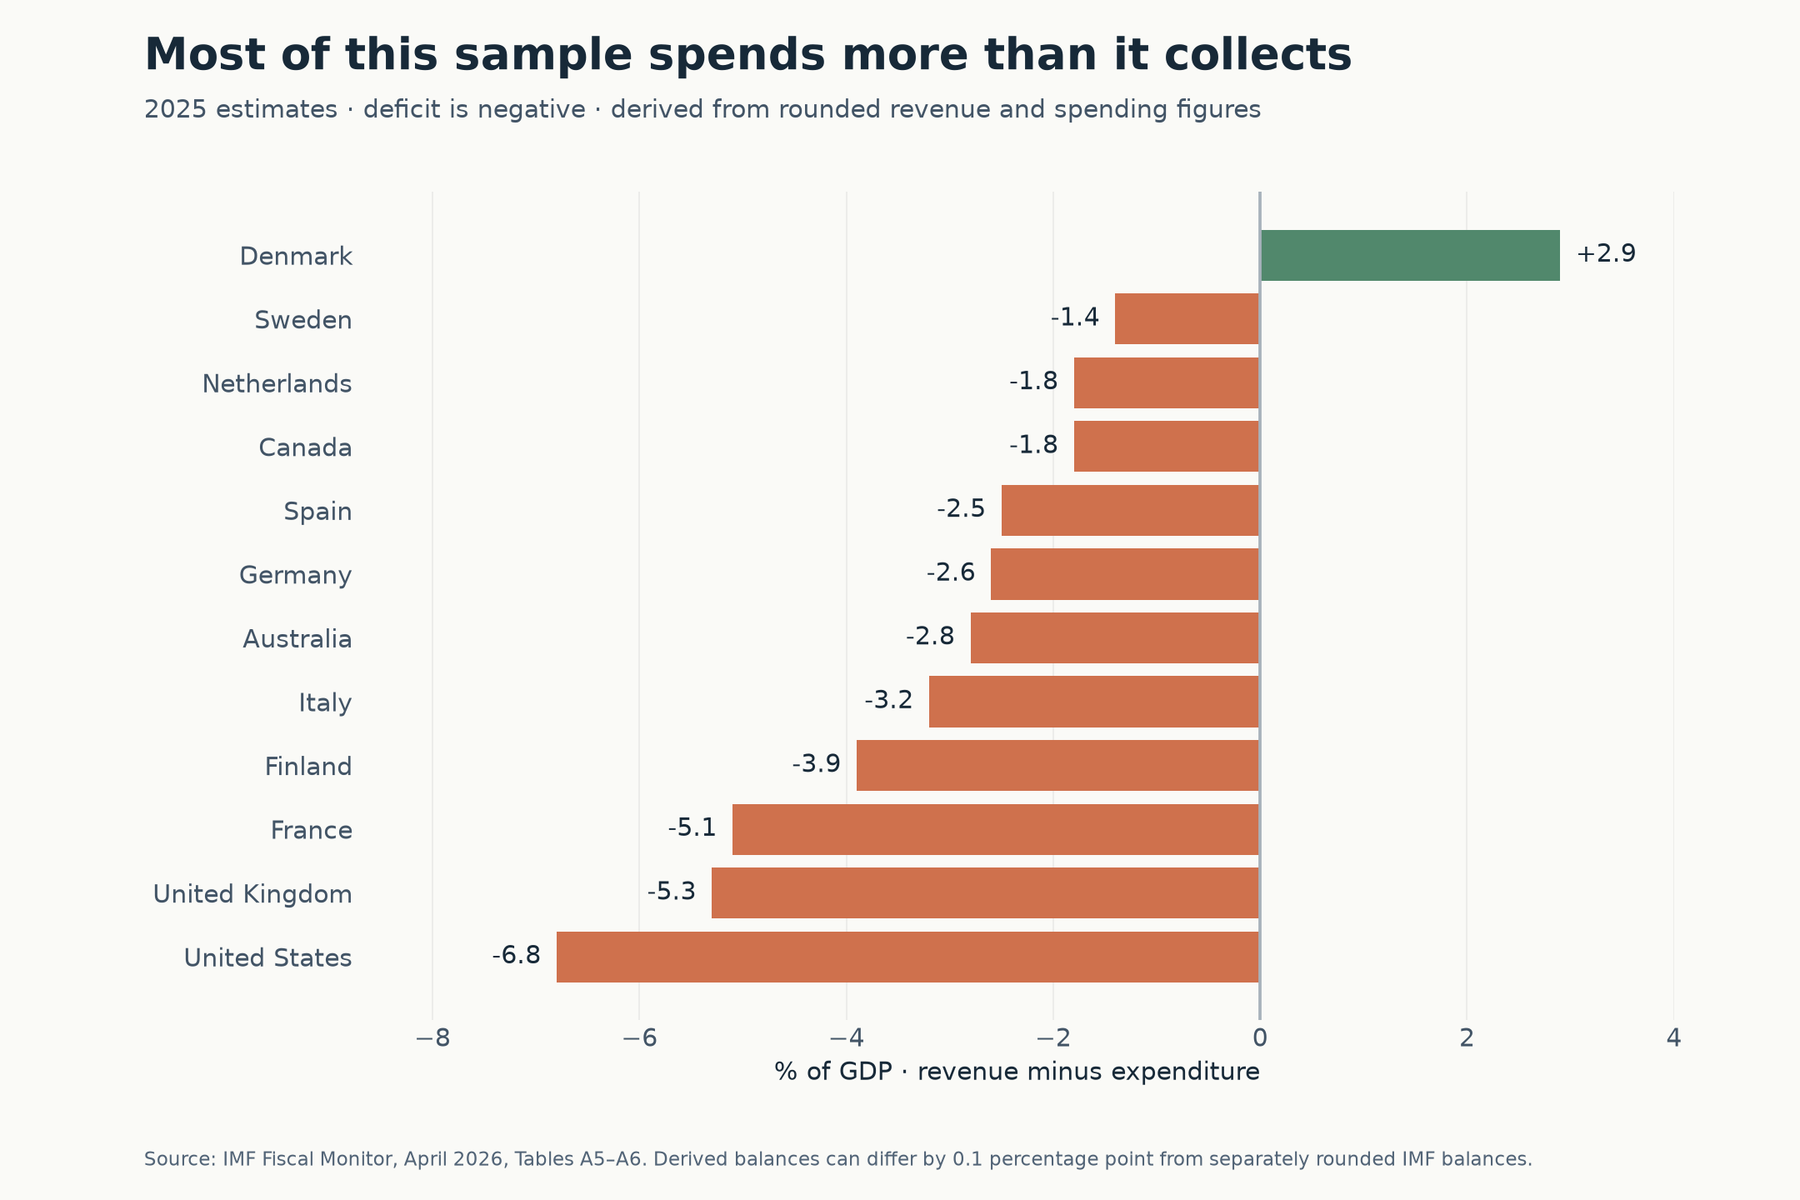
Figure 4. Revenue minus expenditure, calculated from the same rounded inputs. A negative value is a deficit. Derived balances can differ by 0.1 percentage point from the IMF’s separately rounded balance series. 6
| Country | Revenue 2025 | Spending 2025 | Balance 2025¹ | Gross debt 2025 | Gross debt 2031² |
|---|---|---|---|---|---|
| Australia | 36.7 | 39.5 | -2.8 | 51.0 | 49.1 |
| Canada | 42.2 | 44.0 | -1.8 | 113.5 | 103.5 |
| Denmark | 50.5 | 47.6 | +2.9 | 27.5 | 29.8 |
| Finland | 53.7 | 57.6 | -3.9 | 89.3 | 100.8 |
| France | 52.4 | 57.5 | -5.1 | 116.0 | 120.7 |
| Germany | 47.9 | 50.5 | -2.6 | 62.9 | 73.7 |
| Italy | 47.9 | 51.1 | -3.2 | 137.1 | 136.1 |
| Netherlands | 43.3 | 45.1 | -1.8 | 43.3 | 48.0 |
| Spain | 42.2 | 44.7 | -2.5 | 100.4 | 90.4 |
| Sweden | 48.0 | 49.4 | -1.4 | 34.9 | 36.6 |
| United Kingdom | 38.3 | 43.6 | -5.3 | 102.3 | 102.6 |
| United States | 30.9 | 37.7 | -6.8 | 123.9 | 142.1 |
All figures are percentages of GDP. ¹ Calculated from displayed revenue minus expenditure. ² Current-policy projection, April 2026 vintage. The complete inputs, annual series, definitions, and source locators are preserved in the comparison data (file not included in this release). 6
How to read the comparison: the question is not just whether a state is large. Ask whether the revenue system, employment base, and economic growth can sustain the promises it has made. Denmark is a useful counterexample to the claim that a large welfare state necessarily means a large deficit or high debt. France illustrates that substantial revenue does not automatically fund still higher spending. The US illustrates that a smaller government relative to GDP can nevertheless have a substantial recurring funding gap.
The table is not a causal experiment. Countries differ in economic cycles, defence policy, pension institutions, financial assets, tax choices, and shocks. It does not isolate the share of a deficit “caused by welfare,” nor does it estimate what would happen if a country imported another country’s system. Treat the figures as a common accounting frame for asking better questions.
Debt: both its starting level and direction matter
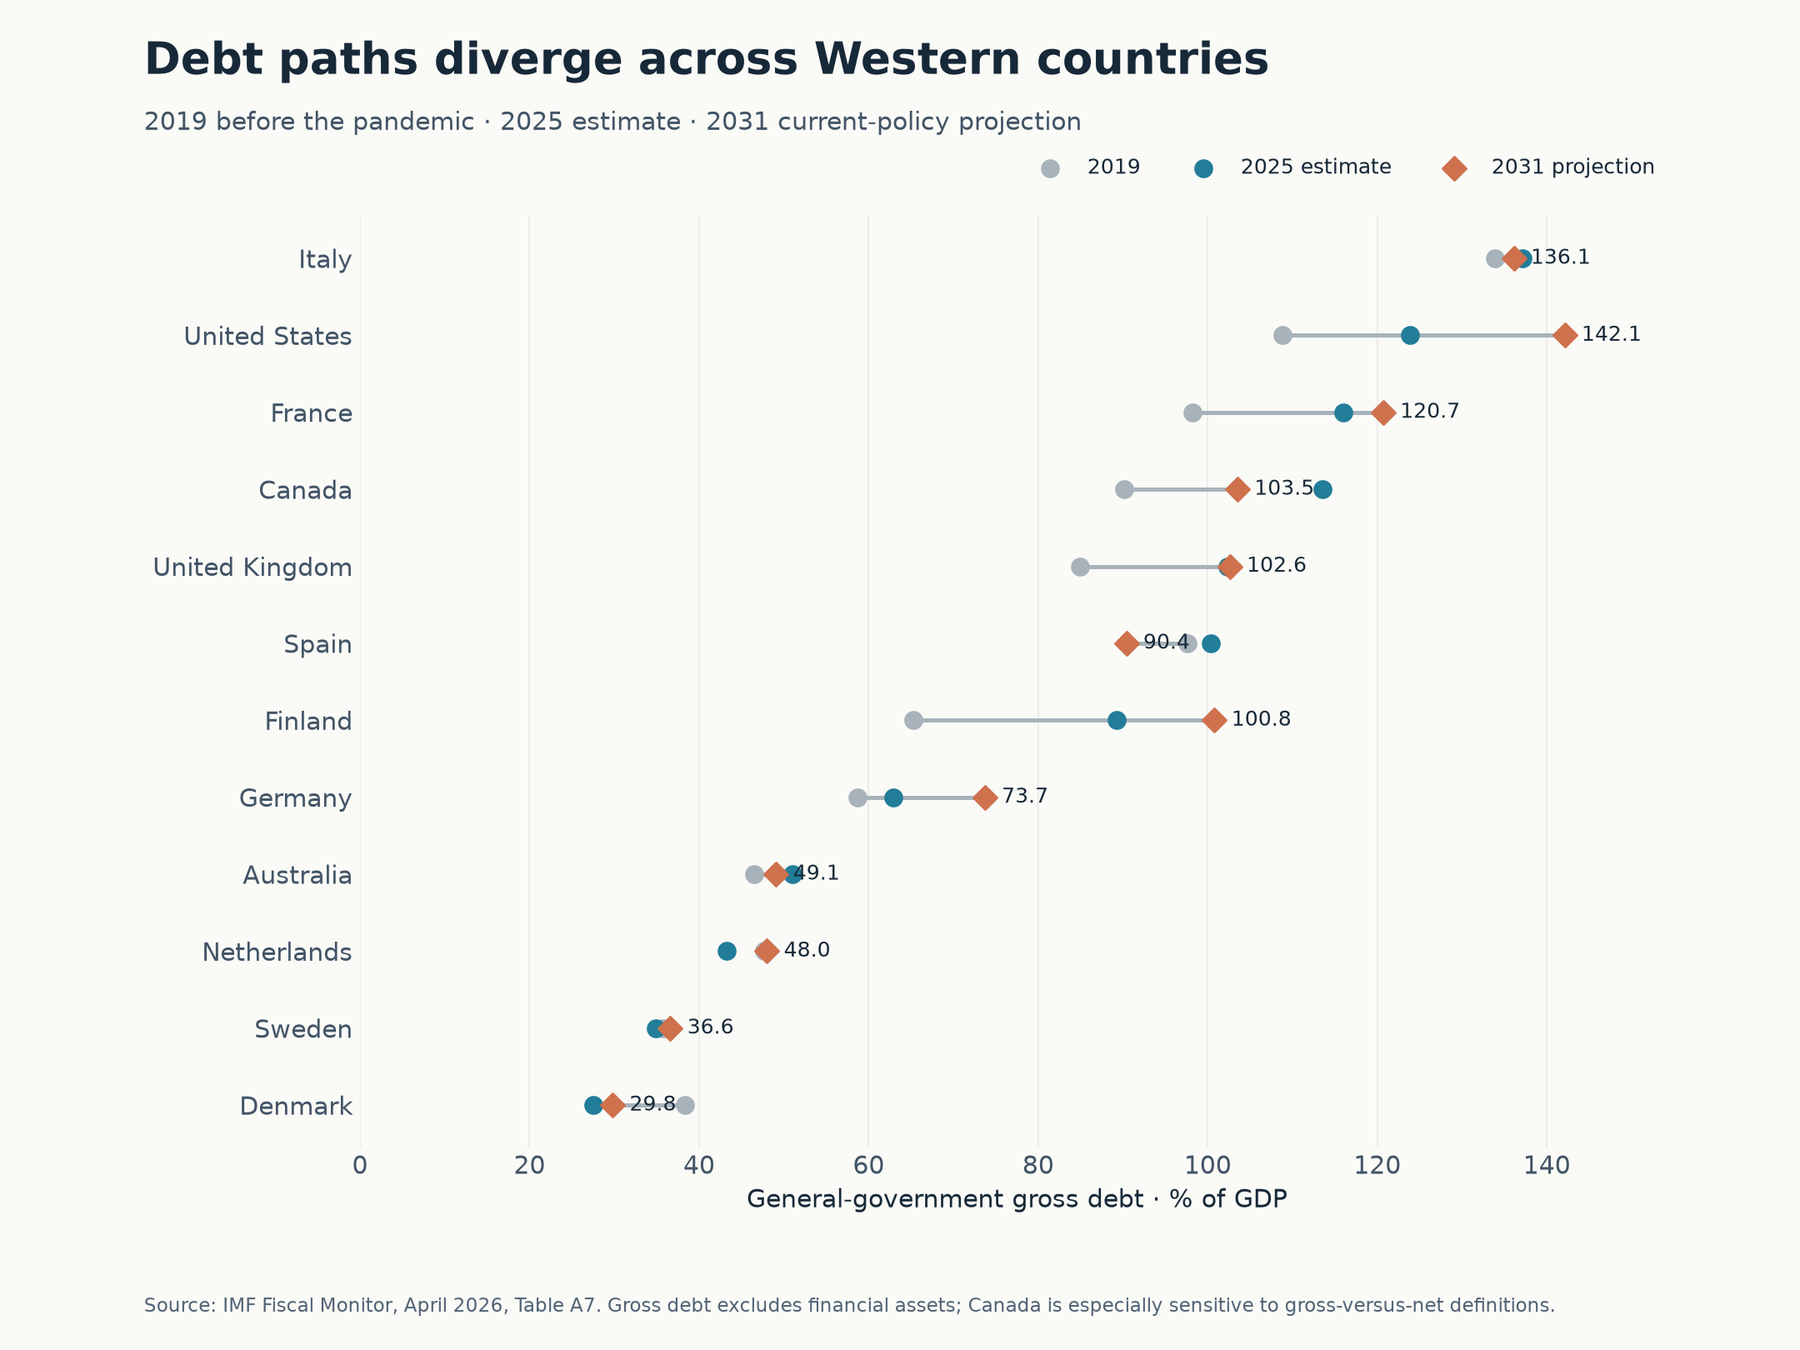
Figure 5. IMF general-government gross debt before the pandemic, in 2025, and projected for 2031. Labels show the 2031 endpoint. A falling ratio can coexist with a rising nominal debt stock if GDP grows faster. 6
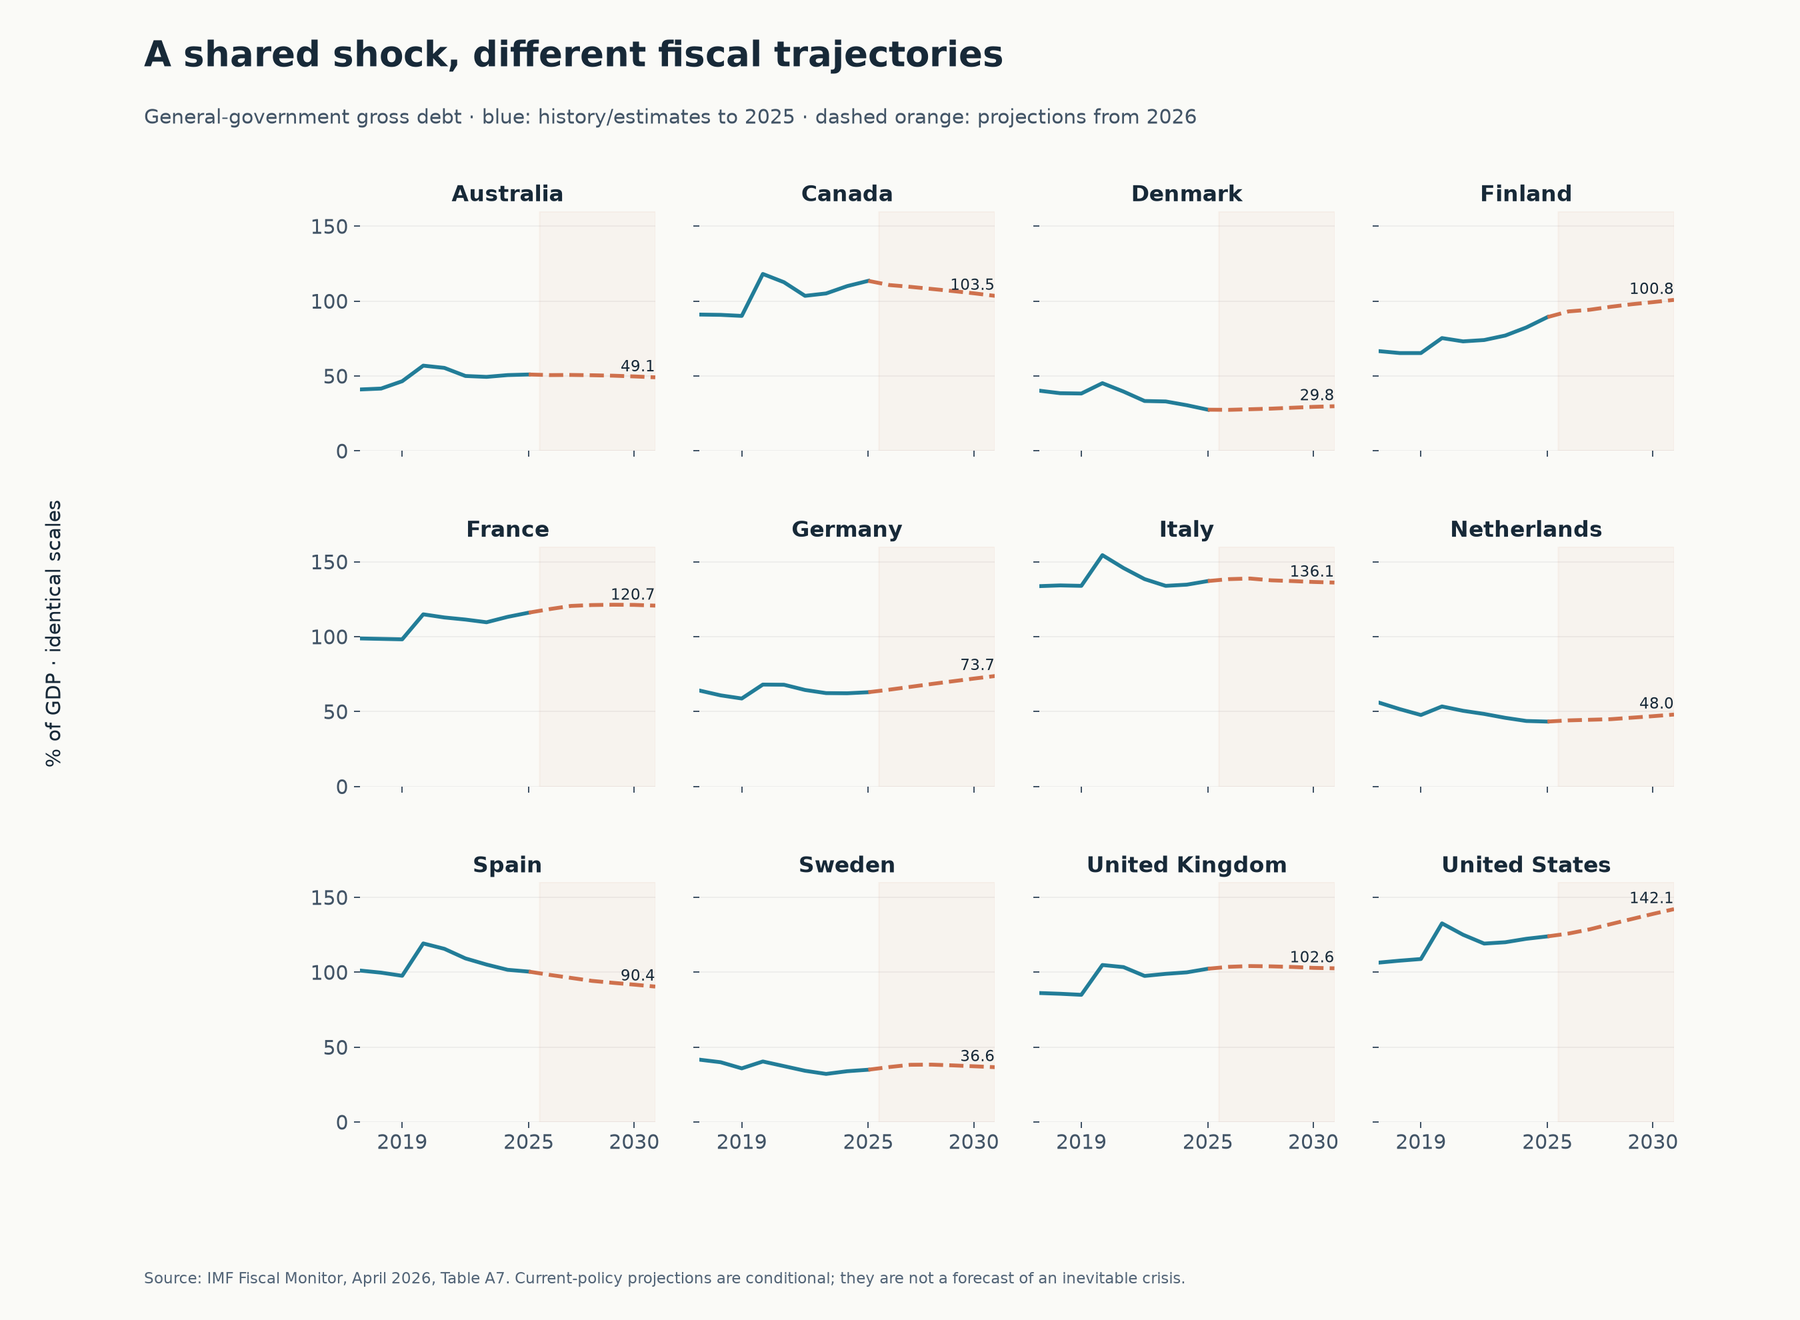
Figure 6. Identical vertical scales across all twelve countries. Solid blue covers history/estimates through 2025; dashed orange shows projections from 2026. These are conditional trajectories from one vintage. 6
A high debt stock makes a government more exposed to financing conditions, but no single debt/GDP threshold predicts default across every country. Currency arrangements, maturity, investor demand, financial assets, institutions, and growth matter. Net debt is especially relevant when comparing Canada with countries that hold fewer offsetting financial assets. IMF Table A8 puts Canadian 2025 net debt at about 10.2% of GDP alongside gross debt of 113.5%; neither number alone describes all future commitments or the liquidity of the assets. 6 (Table A8)
The important inference is that countries do not share one inevitable fiscal destination. The near-term debt outlook and the long-run cost of ageing are also different exercises. A country can have a manageable five-year debt path and a difficult forty-year pension problem, or a large current deficit even after reforms restrain its eventual pension spending.
Britain and the disability-benefit controversy
The official cash-benefit budget includes substantial pension spending
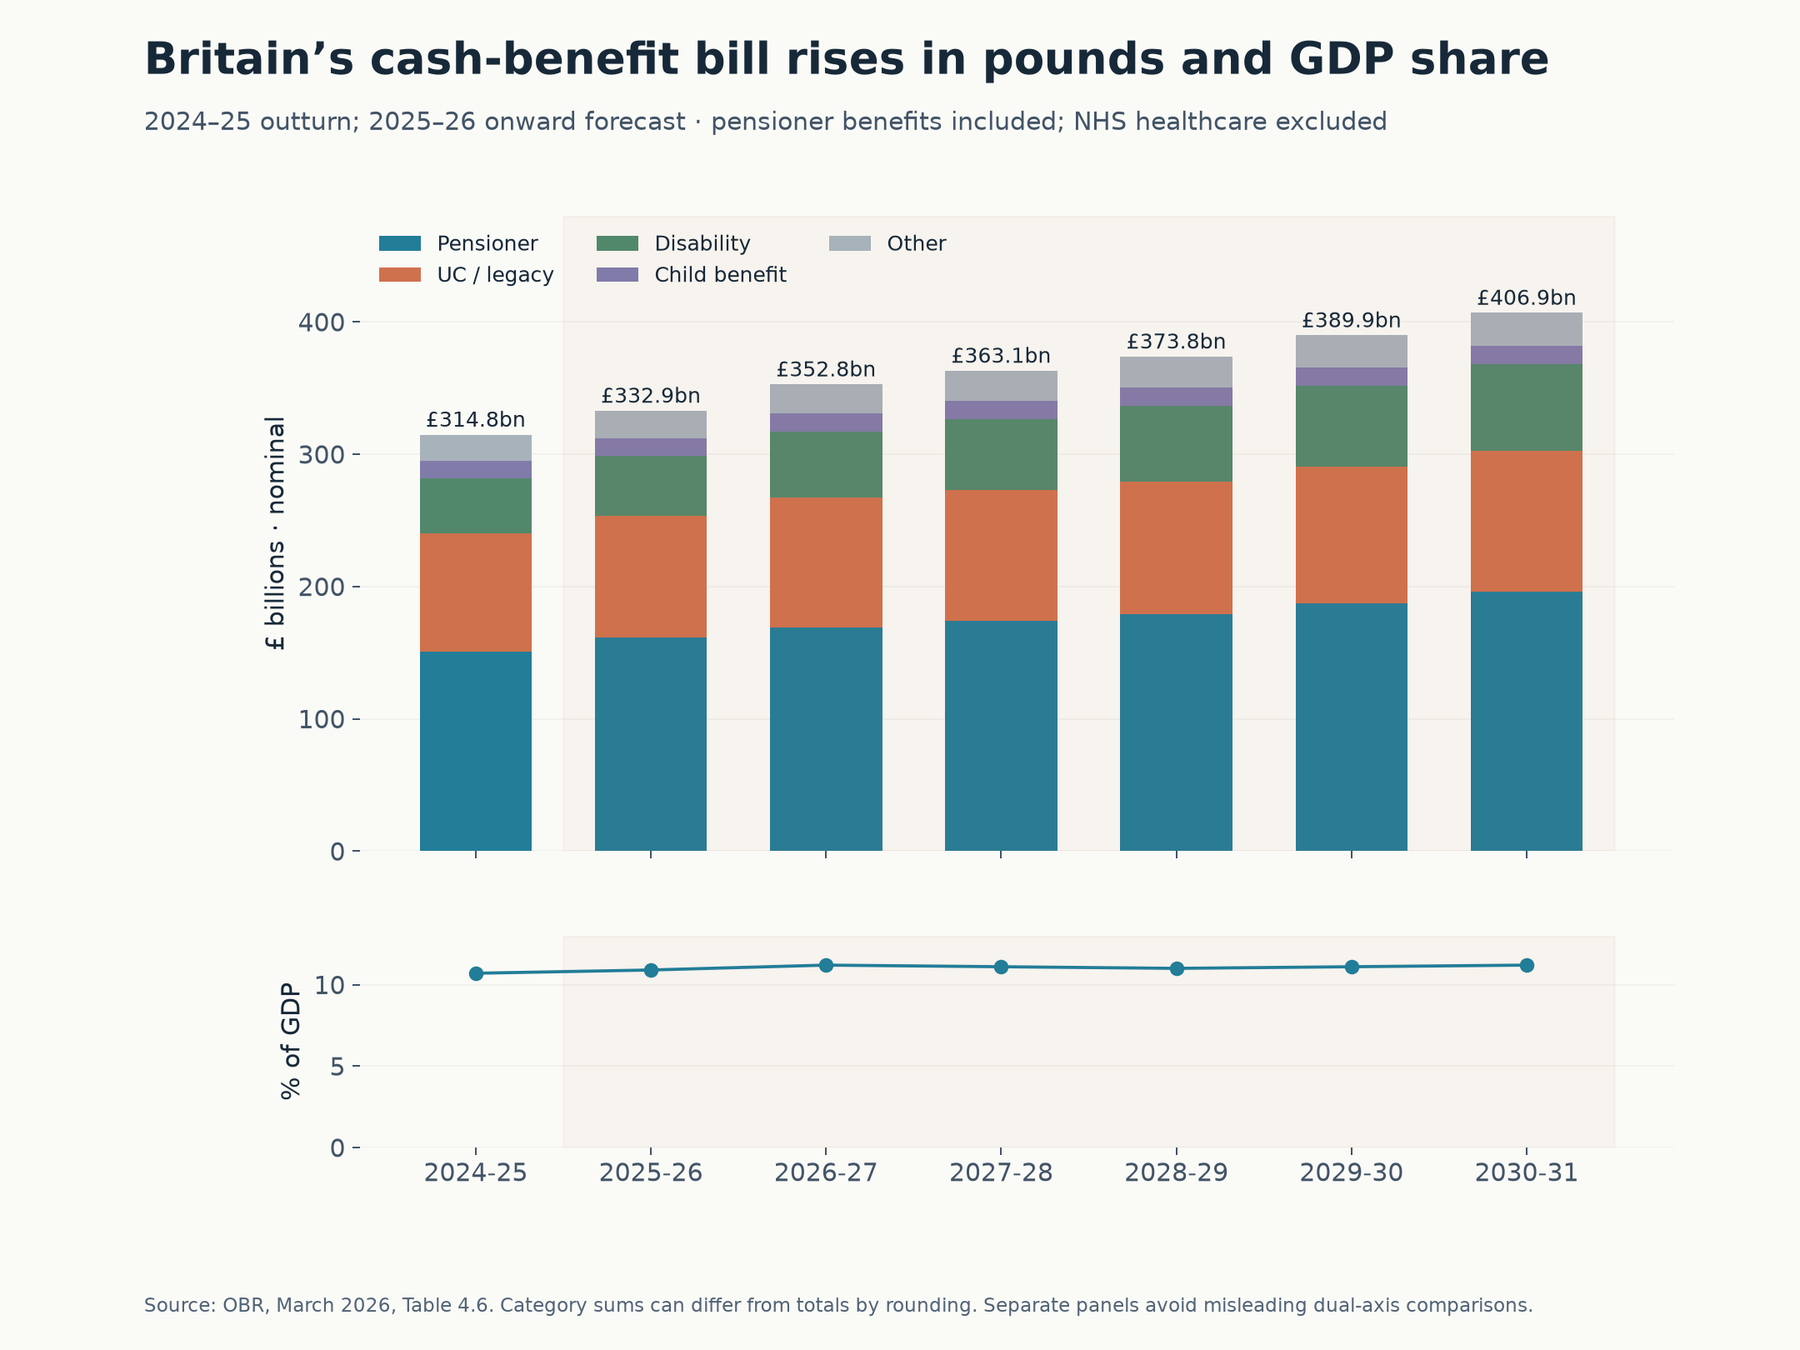
Figure 7. Own chart from OBR March 2026 Table 4.6: £314.8 billion in 2024–25 rising to a projected £406.9 billion in 2030–31; GDP share from 10.7% to 11.2%. Pensioner benefits are included, NHS healthcare excluded. The lower panel shows the GDP share on its own axis. 5
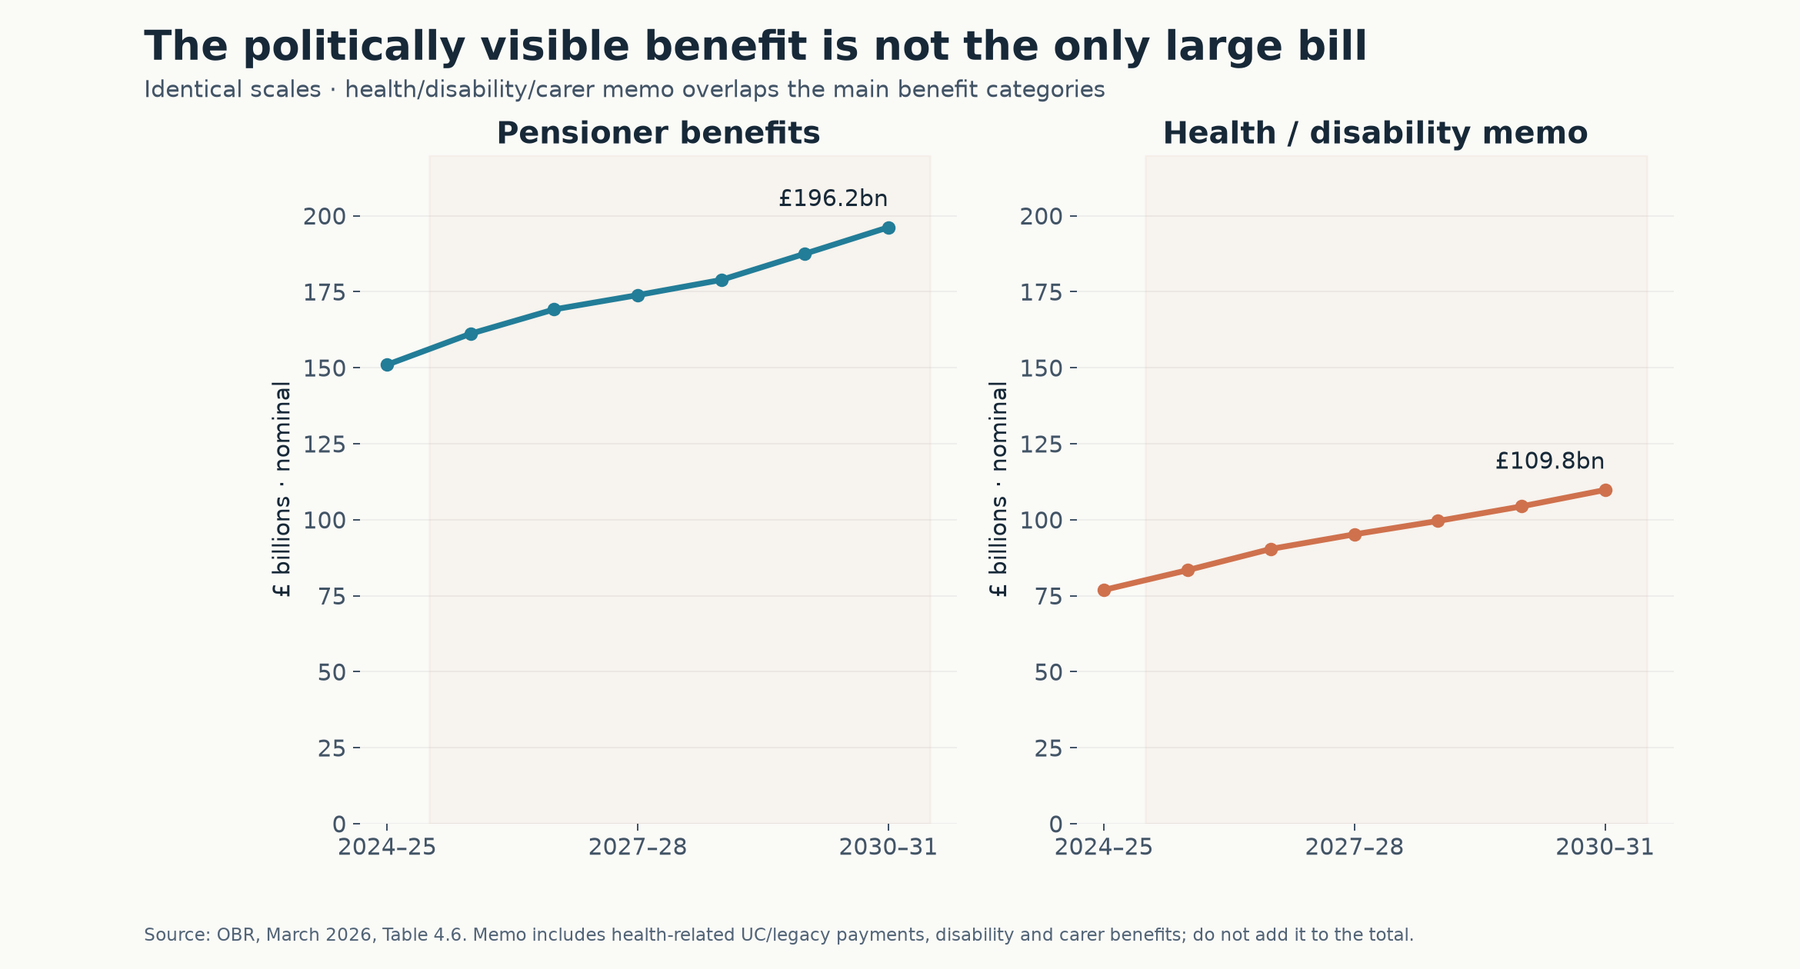
Figure 8. Pensioner spending and the OBR health/disability/carer memorandum line, displayed separately on identical scales. The memorandum overlaps the main budget categories; adding it to the cash-benefit total would double count spending. 5
OBR’s health/disability memo rises from £76.9 billion to £109.8 billion, while pensioner spending rises from £151.0 billion to £196.2 billion, over 2024–25 to 2030–31. Health-related claims matter, but the large pension bill remains central. The official memo includes relevant carer benefits as well as disability and incapacity-related payments. Its scope differs from a broader DWP total that also counts associated housing support. 5
Interpretation: even a successful disability-benefit reform would address one part of the fiscal problem. It cannot by itself resolve ageing-related pensions, NHS spending, defence commitments, interest, and the growth of the tax base. Conversely, a smaller disability program can still be a valuable reform if it improves employment and protects people with severe limitations. “Too small to solve the whole deficit” does not mean “unimportant.”
Resolving the WSJ chart’s definitions
The supplied PDF’s page 3 labels overall welfare spending at £408.6 billion, with a footnote saying pensions and healthcare are excluded. The DWP Spring Forecast 2026 workbook resolves an important part of this puzzle: the UK welfare sheet, cell AM19, reports £408.554 billion for 2030–31, which rounds to £408.6 billion. That total includes pension expenditure; cell AM22 gives the OBR-consistent total of £406.906 billion. The figure therefore closely matches an official total, but the chart’s pension-exclusion wording is incompatible with that matched definition. This is a source-label discrepancy, not evidence that the whole spending estimate was fabricated. 2 (PDF p. 3) 10
The £130.61 billion health-related figure has a different resolution. DWP’s Table 4, cell CH25, gives a broader-definition total of £130.6048 billion in 2030–31, within about £5.2 million of the article’s £130.61 billion. This substantially reconciles the measure, although that small residual difference remains unresolved. It includes disability, incapacity and carer benefits, associated housing benefit, the housing element of UC for health-related claimants, and specified additional benefits. It excludes ordinary state-pension payments even if the recipient is disabled. The narrower OBR memo already includes carers; the larger number cannot be explained simply by adding carers. 10
DWP’s territorial coverage also requires care: its reserved benefits cover Great Britain while devolved-benefit coverage generally shifts to England and Wales. Table 4(i) and 4(ii) address those boundaries differently. The chart below starts in 2024–25, after that devolution break, and describes the DWP scope rather than presenting the total as a complete harmonized UK/EU measure.
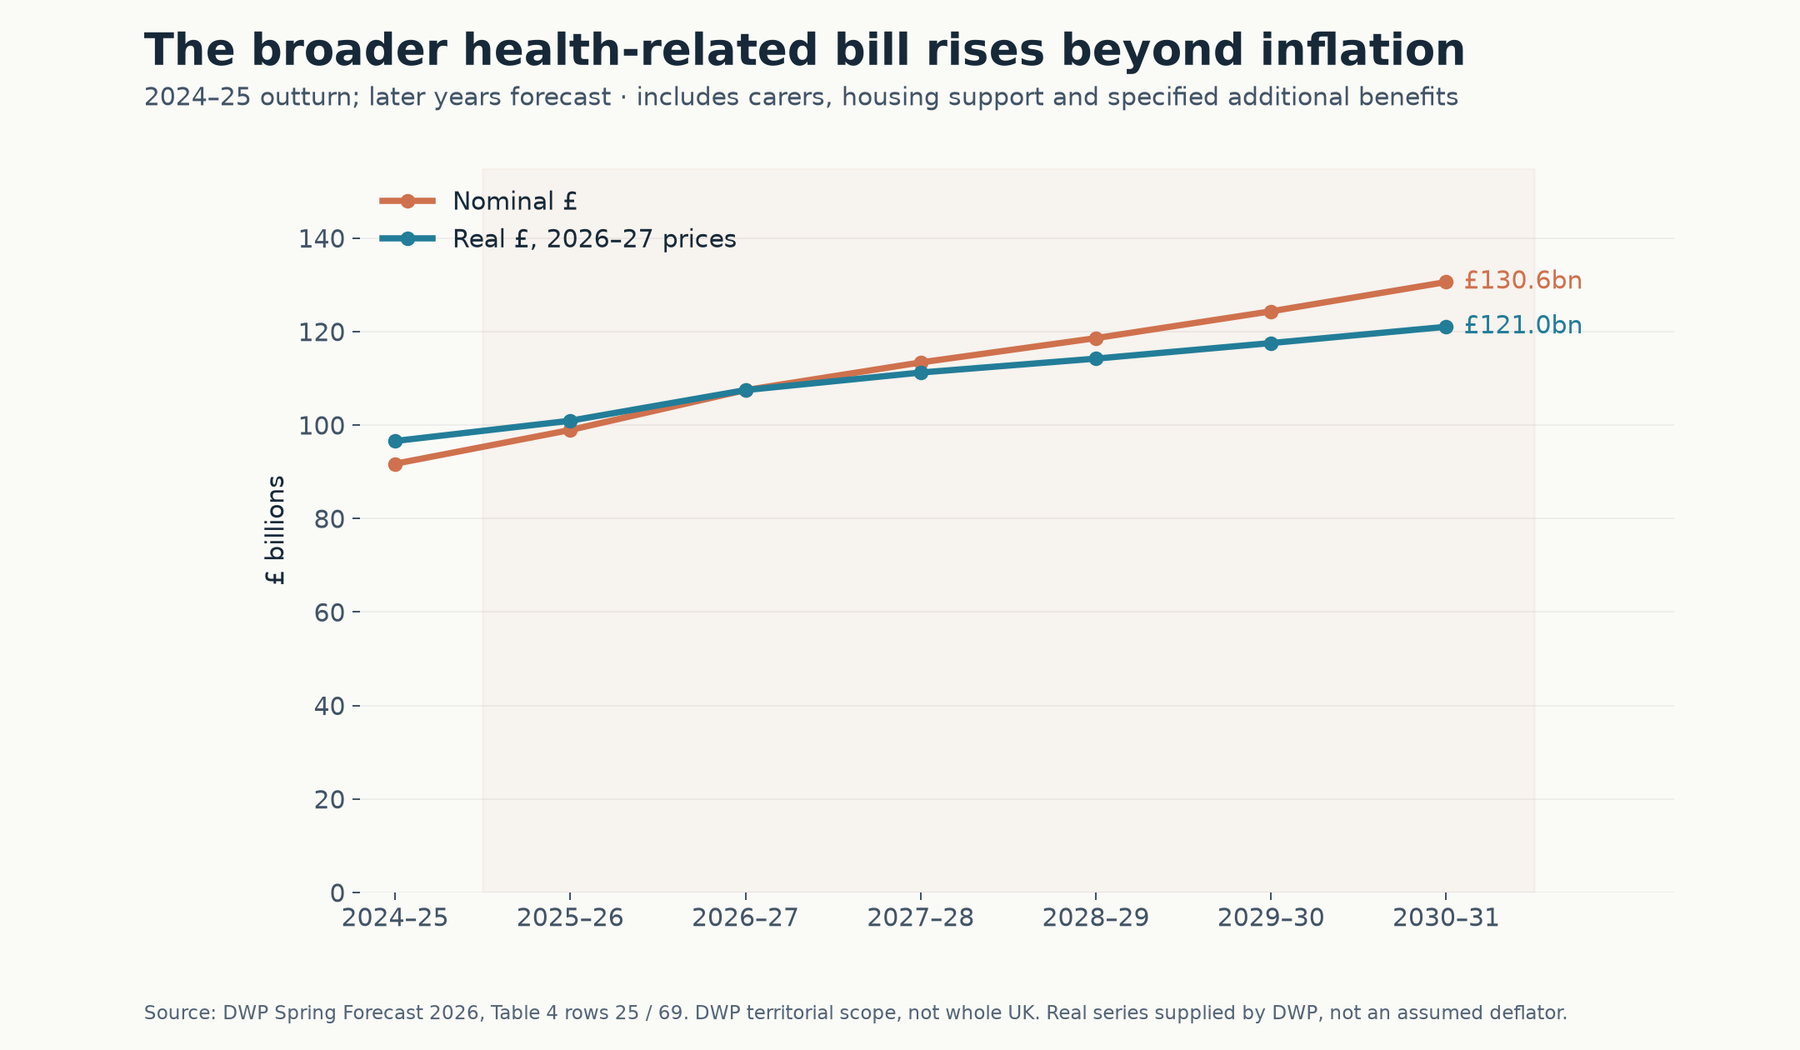
Figure 9. DWP’s broader health/disability/carer-related expenditure, including associated housing support. Both nominal and real series come directly from its Spring Forecast 2026 workbook; real pounds use 2026–27 prices. The scope is DWP executive competence, not all UK spending. Later years are forecasts. 10
The projected increase persists after inflation adjustment. This strengthens the article’s substantive concern while making the expenditure definition explicit. The PDF’s separate comparison of an EU figure around 27% with a US figure around 21% also lacks enough definition to establish a fully comparable gap. ESSPROS benefits and OECD gross public social spending cannot be substituted for one another. Figures 1–2 use one workbook and one year instead.
Caseload growth is not the same as fraud prevalence
The WSJ reports seven million people receiving at least one sickness/disability benefit and a working-age increase from 2.9 million in 2019 to 4.7 million. These are attributed article figures; this dossier has not independently reproduced that deduplicated person count. DWP explicitly warns that summing individual benefit caseloads is invalid because people can receive more than one benefit. Likewise, a UK–US comparison of PIP, incapacity support, SSDI and SSI requires matching eligibility, ages, territories, overlap and private programs before drawing a relative generosity conclusion. 2 (PDF p. 2) 10
The opening fraud conviction illustrates a real enforcement concern as reported by the WSJ. It does not measure how many recipients are fraudulent. Motability’s ordinary, unadapted vehicles are not inherently evidence of abuse: some recipients have mobility limitations without requiring vehicle modifications, and some are passengers. The PDF’s correction also matters: the program supplies a lease, not a car as a gift. Reporting a diagnosis such as anxiety, dyslexia or acne does not by itself reproduce the functional-needs assessment or demonstrate ineligibility.
DWP’s FYE 2026 estimates put PIP expenditure overpaid at 2.3%, including 1.4% attributed to fraud, 0.7% claimant error, and 0.2% official error. Separately, 3.6% was excluded from the headline overpayment measure because claimants were not reasonably expected to know they should report a change. The headline increase was statistically significant, but it is not a measure that 2.3% of recipients are fraudsters; it concerns the share of expenditure. “Four in 100 claims incorrect” is another denominator, including over- and underpayments. 11 (section 7)
Assessment: enforcement problems and definitional exclusions deserve scrutiny. These estimates do not support treating most claimants as fraudulent. Nor does low measured fraud settle whether eligibility rules are well designed, whether claims are assessed accurately, or whether legal benefits discourage some people from working. Those are distinct questions.
Work incentives need a causal test
The article’s example comparing roughly £2,000 of benefits with £1,880 of after-tax minimum-wage earnings is a conditional example, not a universal calculation of the gain from work. A proper model must specify rent, household composition, age, earnings, disability entitlement, UC tapering, council-tax support, and benefits retained while working. PIP can be paid to people in employment. Comparing all benefits out of work with wages alone can omit support retained in work and the extra costs associated with disability. 2 (PDF pp. 7–10) 3 (tax-benefit models)
The reported decline from 40% employed among new PIP claimants to 25% two years later also does not identify a benefit’s causal effect. A worsening illness could produce both a claim and later job loss. Employer accommodations, assessment delays, regional demand and treatment access could contribute. It is reasonable to investigate incentives; the correct conclusion is not available from that before/after comparison alone.
Where the pressure is headed
Pensions, healthcare and care are the large structural exposures
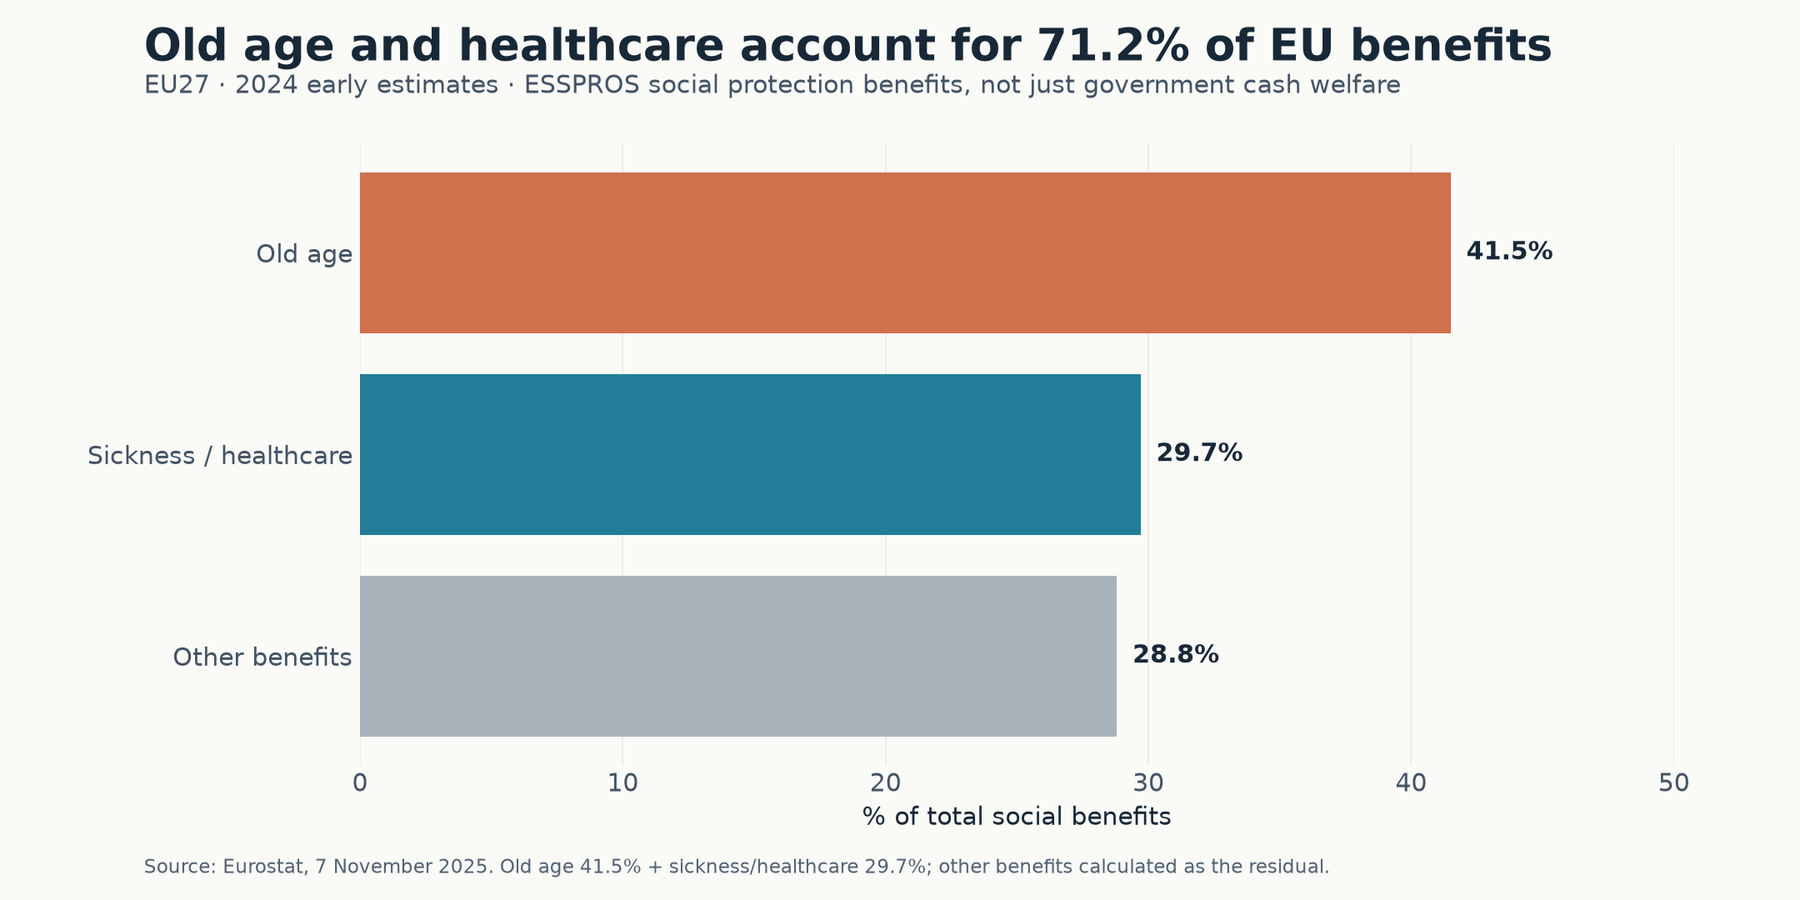
Figure 10. Eurostat 2024 early estimates: old age accounts for 41.5% of EU27 social benefits and sickness/healthcare 29.7%; together 71.2%. The remaining 28.8% is calculated as the residual. This is ESSPROS social protection, not simply public cash benefits. 4
Eurostat estimates EU social-benefit expenditure at €4.925 trillion, 27.3% of GDP, in 2024. The reported 6.9% increase is nominal relative to 2023; the GDP share rose by 0.6 percentage point. These measures establish recent expansion in that reporting system. They do not identify how much was inflation, how much was real protection, or what proportion represents avoidable waste. 4
The composition changes the political question. Large social budgets principally pay for old age and healthcare. Retirees and patients include people across the income distribution, and contributors often regard pensions as an earned entitlement. A reform framed around unemployed recipients can therefore leave the largest expenditure commitments untouched.
Ageing raises the support burden even if policy restrains expenditure
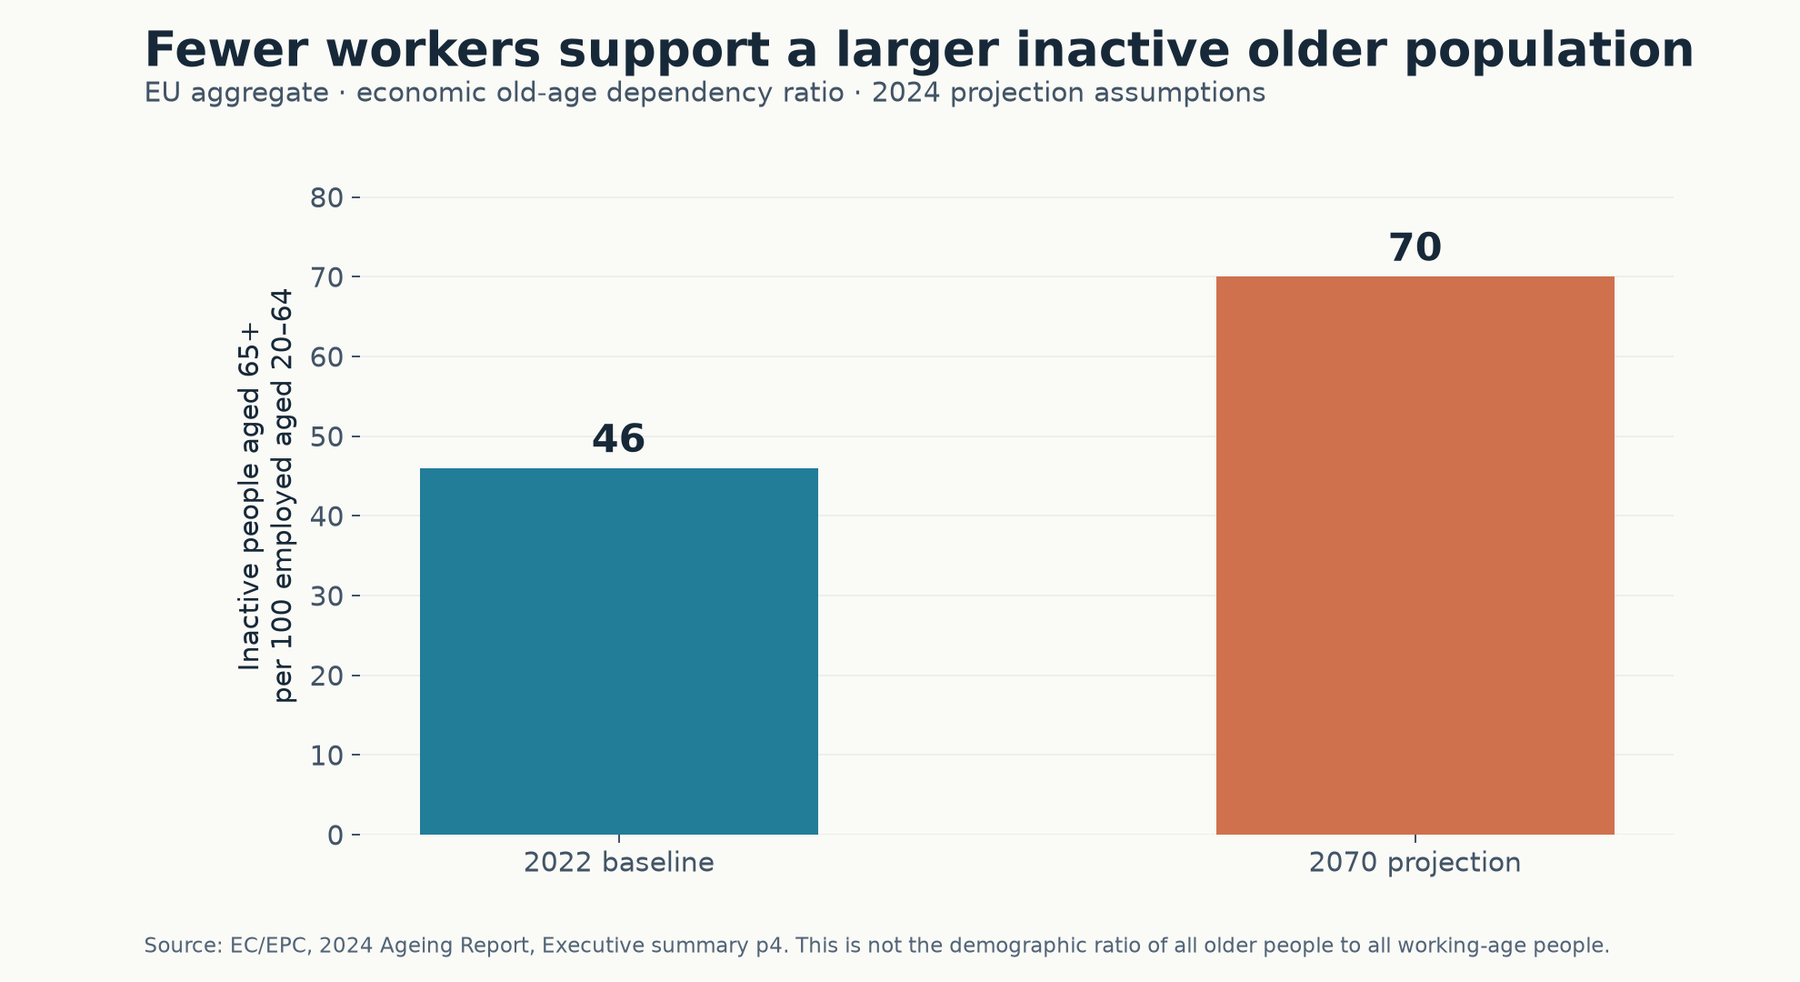
Figure 11. The Commission’s economic old-age dependency ratio rises from about 46 inactive people aged 65+ per 100 employed people aged 20–64 in 2022 to 70 in 2070. This differs from the demographic dependency ratio, which uses populations rather than employment. 12 (executive summary p. 4)
Population ageing creates pressure through both sides of the budget: more people draw pensions and care while the employment base grows more slowly. But a budget ratio also depends on retirement ages, pension formulas, employment rates, productivity and care delivery. Changing those policies can restrain spending even with a more difficult demographic ratio. Spending restraint may then appear as longer working lives or a lower pension relative to earnings, so budget sustainability and benefit adequacy must both be examined.
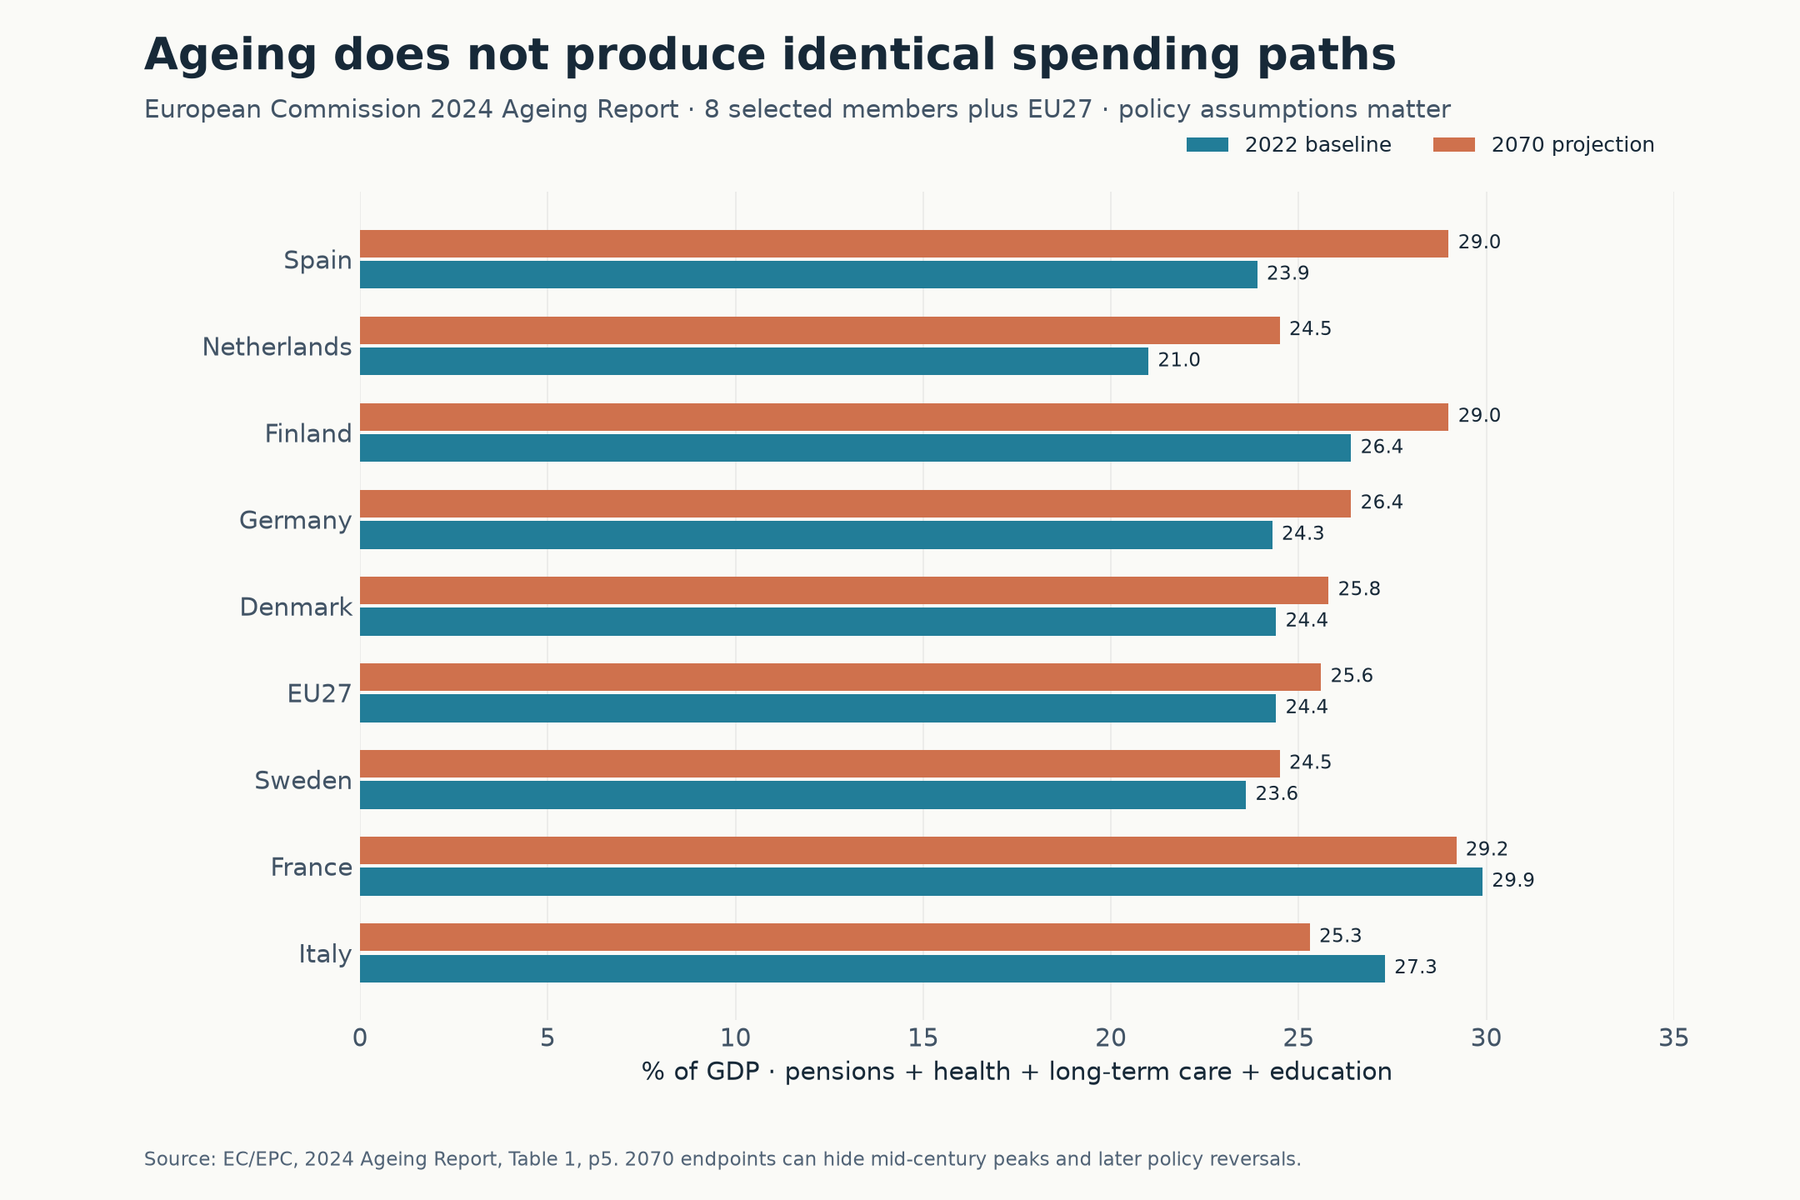
Figure 12. European Commission/EPC 2024 Ageing Report baseline: selected countries’ public pensions, health, long-term care and education combined, 2022 versus 2070. This category includes education and is not identical to SOCX welfare spending. 12 (Table 1, p. 5)
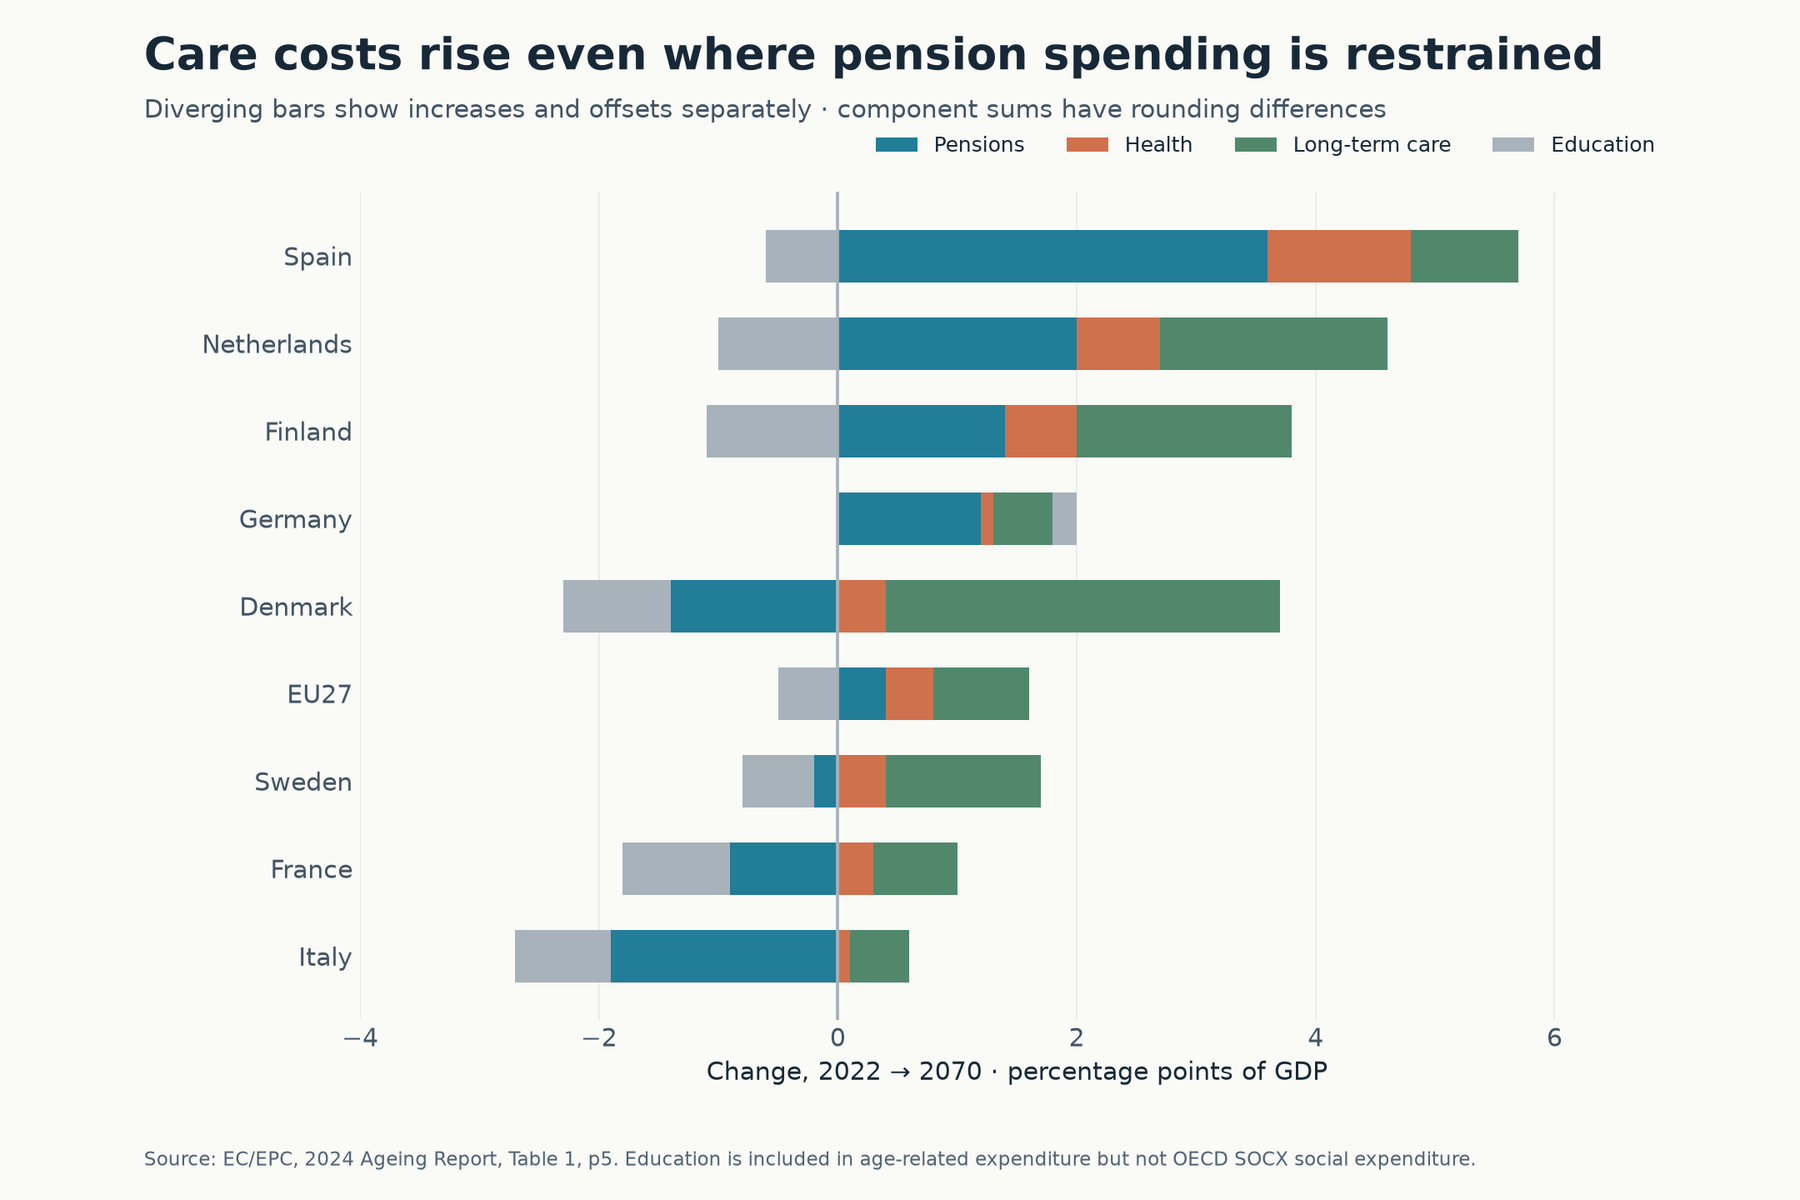
Figure 13. Contributions to the projected change, in percentage points of GDP. Negative pension or education changes offset increases elsewhere. Rounded components need not sum exactly to rounded totals. 12
The same baseline projects total age-related expenditure rising from 24.4% to 25.6% of GDP for the EU aggregate, with much larger increases in some countries. Existing reforms help explain projected pension restraint elsewhere. The 2070 endpoint can conceal an earlier peak, and later policy reversals can invalidate an assumption. The French projection predates the subsequently verified pension pause discussed below. An official long-term projection is a conditional model, not an unconditional prediction.
Britain’s longer-run warning is stronger than a disability-only story
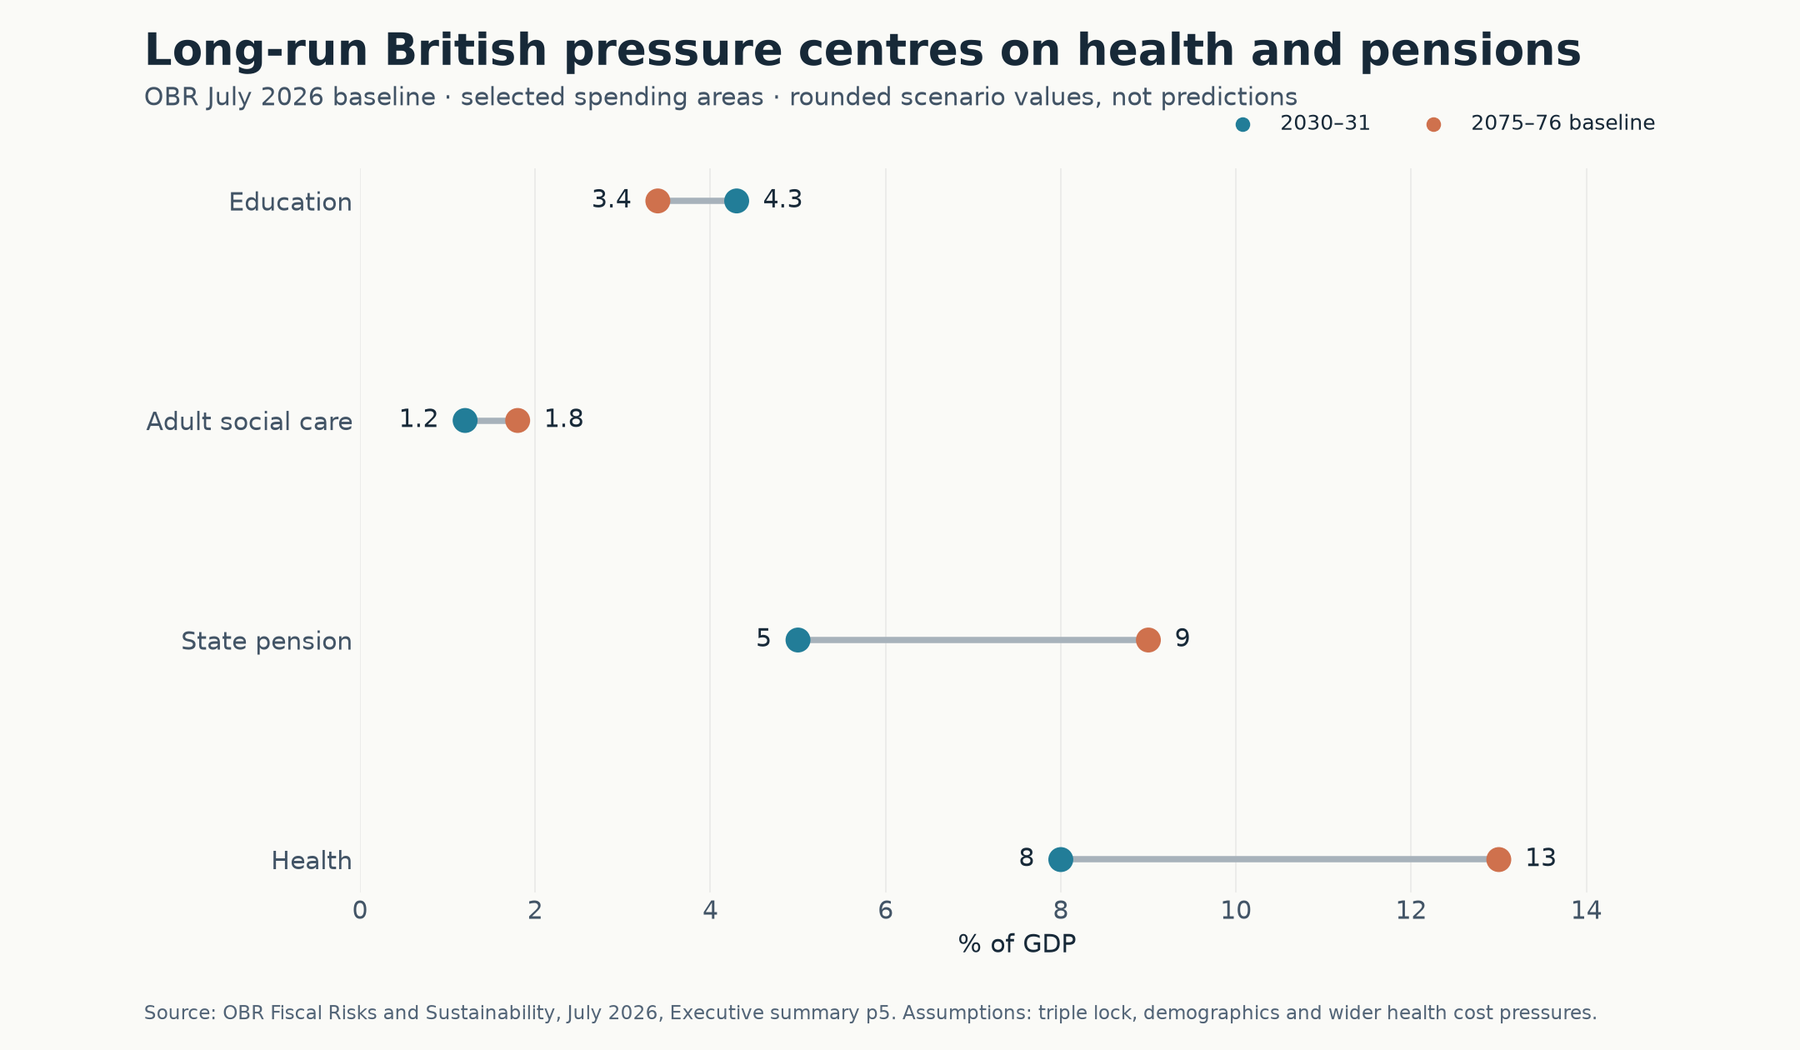
Figure 14. OBR July 2026 baseline, rounded selected spending shares: health 8% to 13% of GDP, state pension 5% to around 9%, adult social care 1.2% to 1.8%, education 4.3% to 3.4%, between 2030–31 and 2075–76. 13 (executive summary p. 5)
OBR models a baseline adjustment of 3.8% of GDP, immediate and permanent from 2031–32, to keep debt from exceeding its projected starting level of 95% of GDP at the end of the horizon. This is a modeled fiscal gap, not a forecasted single-year cut that government has decided to impose. Its long-run paths explicitly require a policy response and should not be read as plausible predictions of debt continuing unaltered into the 2070s. 13 (pp. 12–14)
Implication: delay matters because interest compounds and later cohorts have less time to adjust. The available responses include revenues, entitlement parameters, service productivity, employment and the wider growth environment. Assuming a future technological breakthrough will pay for everything is risky; assuming productivity can never improve is also too strong.
The United States has a different institutional problem with similar arithmetic
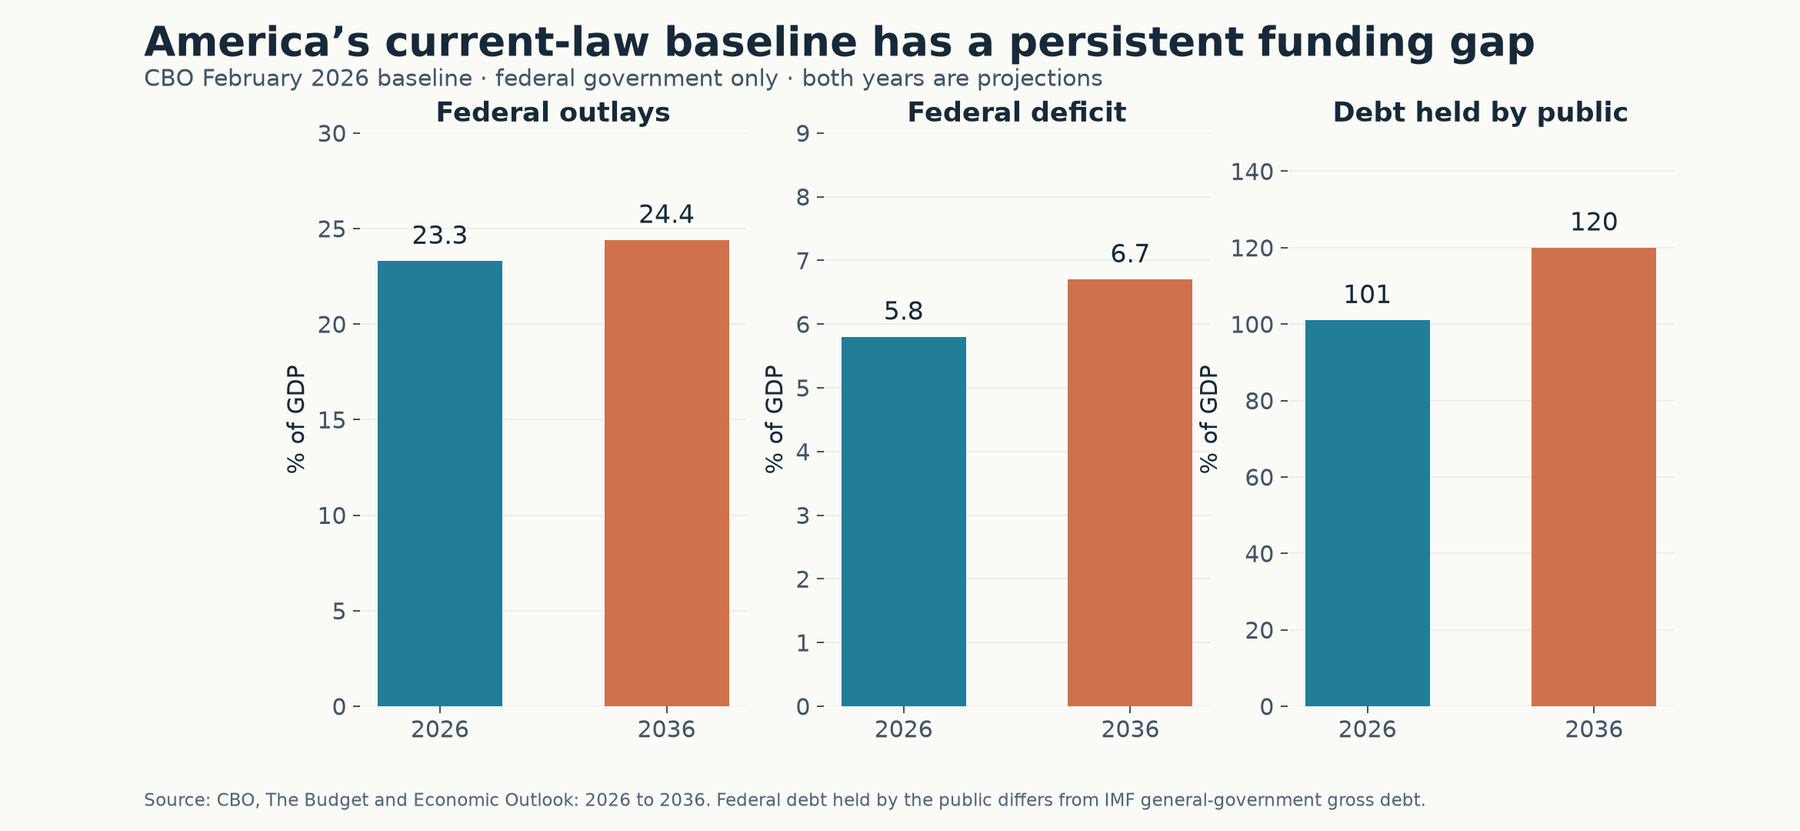
Figure 15. CBO February 2026 baseline: federal outlays, federal deficit and federal debt held by the public in 2026 and 2036. This debt definition and government perimeter differ from the IMF country charts. 7
CBO projects a 5.8% of GDP federal deficit in 2026, growing to 6.7% in 2036, with debt held by the public rising from 101% to 120%. Its explanation emphasizes Social Security, Medicare and interest costs. This is not evidence that means-tested cash assistance alone drives the American deficit. Nor are federal and general-government percentages interchangeable. The law and economic assumptions of this dated baseline must be revisited after subsequent changes. 7
Interest can turn a manageable gap into a more expensive adjustment
Debt dynamics can be expressed as:
Here is debt/GDP, the effective nominal interest rate on the debt stock, nominal GDP growth, the primary deficit/GDP, and stock-flow adjustments. A primary deficit excludes interest; it is positive in this notation. Stock-flow adjustments capture changes in debt not explained by that budget balance. This accounting framework does not assume that every new bond carries the current market yield.
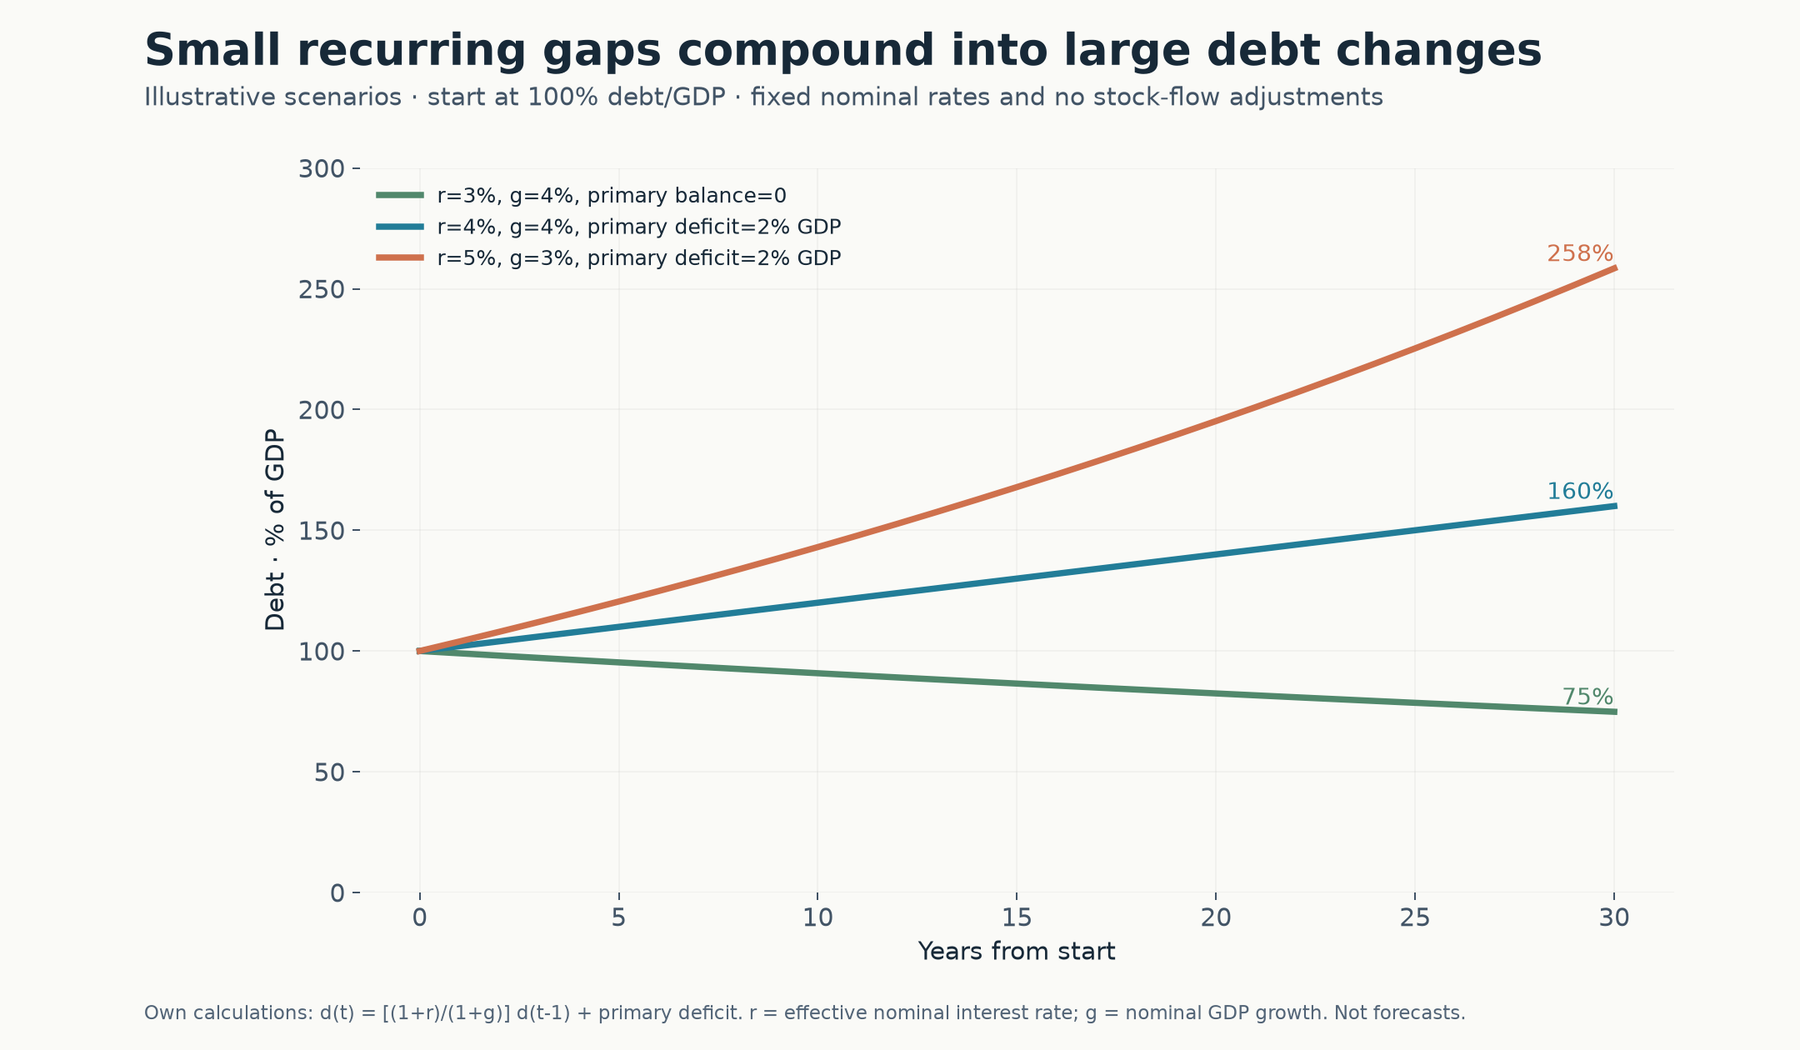
Figure 16. Own illustrative calculation, not a country forecast: start at debt of 100% of GDP, hold rates constant, set stock-flow adjustments to zero. After 30 years the three specified cases produce approximately 75%, 160%, and 258% of GDP.
The illustration separates the financing mechanism from political claims. When interest exceeds growth, stabilizing a large debt stock is harder. Growth exceeding interest helps, but persistent primary deficits can still increase debt. Inflation can sometimes reduce the real value of fixed nominal debt, while also raising refinancing costs, indexed benefits, and public wages. It is not a reliable cost-free financing strategy.
The WSJ’s contemporaneous gilt-yield figures are reported market observations, not reproduced live data here. A rise in yields cannot be attributed to welfare spending alone: inflation expectations, monetary policy, expected issuance, duration risk and global bond conditions also matter. A coherent explanation must distinguish a government’s marginal borrowing cost from the rate on its entire outstanding debt.
Why adjustment is politically difficult
Voters experience the losses immediately and the benefits indirectly
An eligibility restriction can identify a household that loses income next month. A higher pension age identifies someone who must work longer. A reduced hospital budget can produce a visible queue or closure. The benefits of fiscal adjustment are less concrete: lower future financing risk, fewer future tax rises, or more room to respond to emergencies. That mismatch gives organized opponents a natural political advantage.
This is not necessarily irrational behavior. People may have planned retirement or employment around existing rules. A late change can impose a loss they cannot undo. They may also distrust assurances that savings will improve services rather than finance another group’s tax reduction. Government credibility and perceived fairness are therefore part of the reform problem, not merely obstacles to a technically correct spreadsheet.
Many welfare systems cover middle-income voters as well as people on low incomes. Universal or contributory benefits can create durable support because contributors expect to become recipients. Narrow means testing can improve budget targeting but also create high withdrawal rates, complexity, stigma and weaker political support. These are tradeoffs, not proof that either design is always superior.
Coordinator inference: ageing can strengthen the political constituency for pension protection at the same time as it raises fiscal costs. But population shares alone do not establish how older citizens vote. This note does not claim that all pensioners favor all benefits, or that a higher millionaire share causes opposition to every tax increase.
The financing side also has organized interests
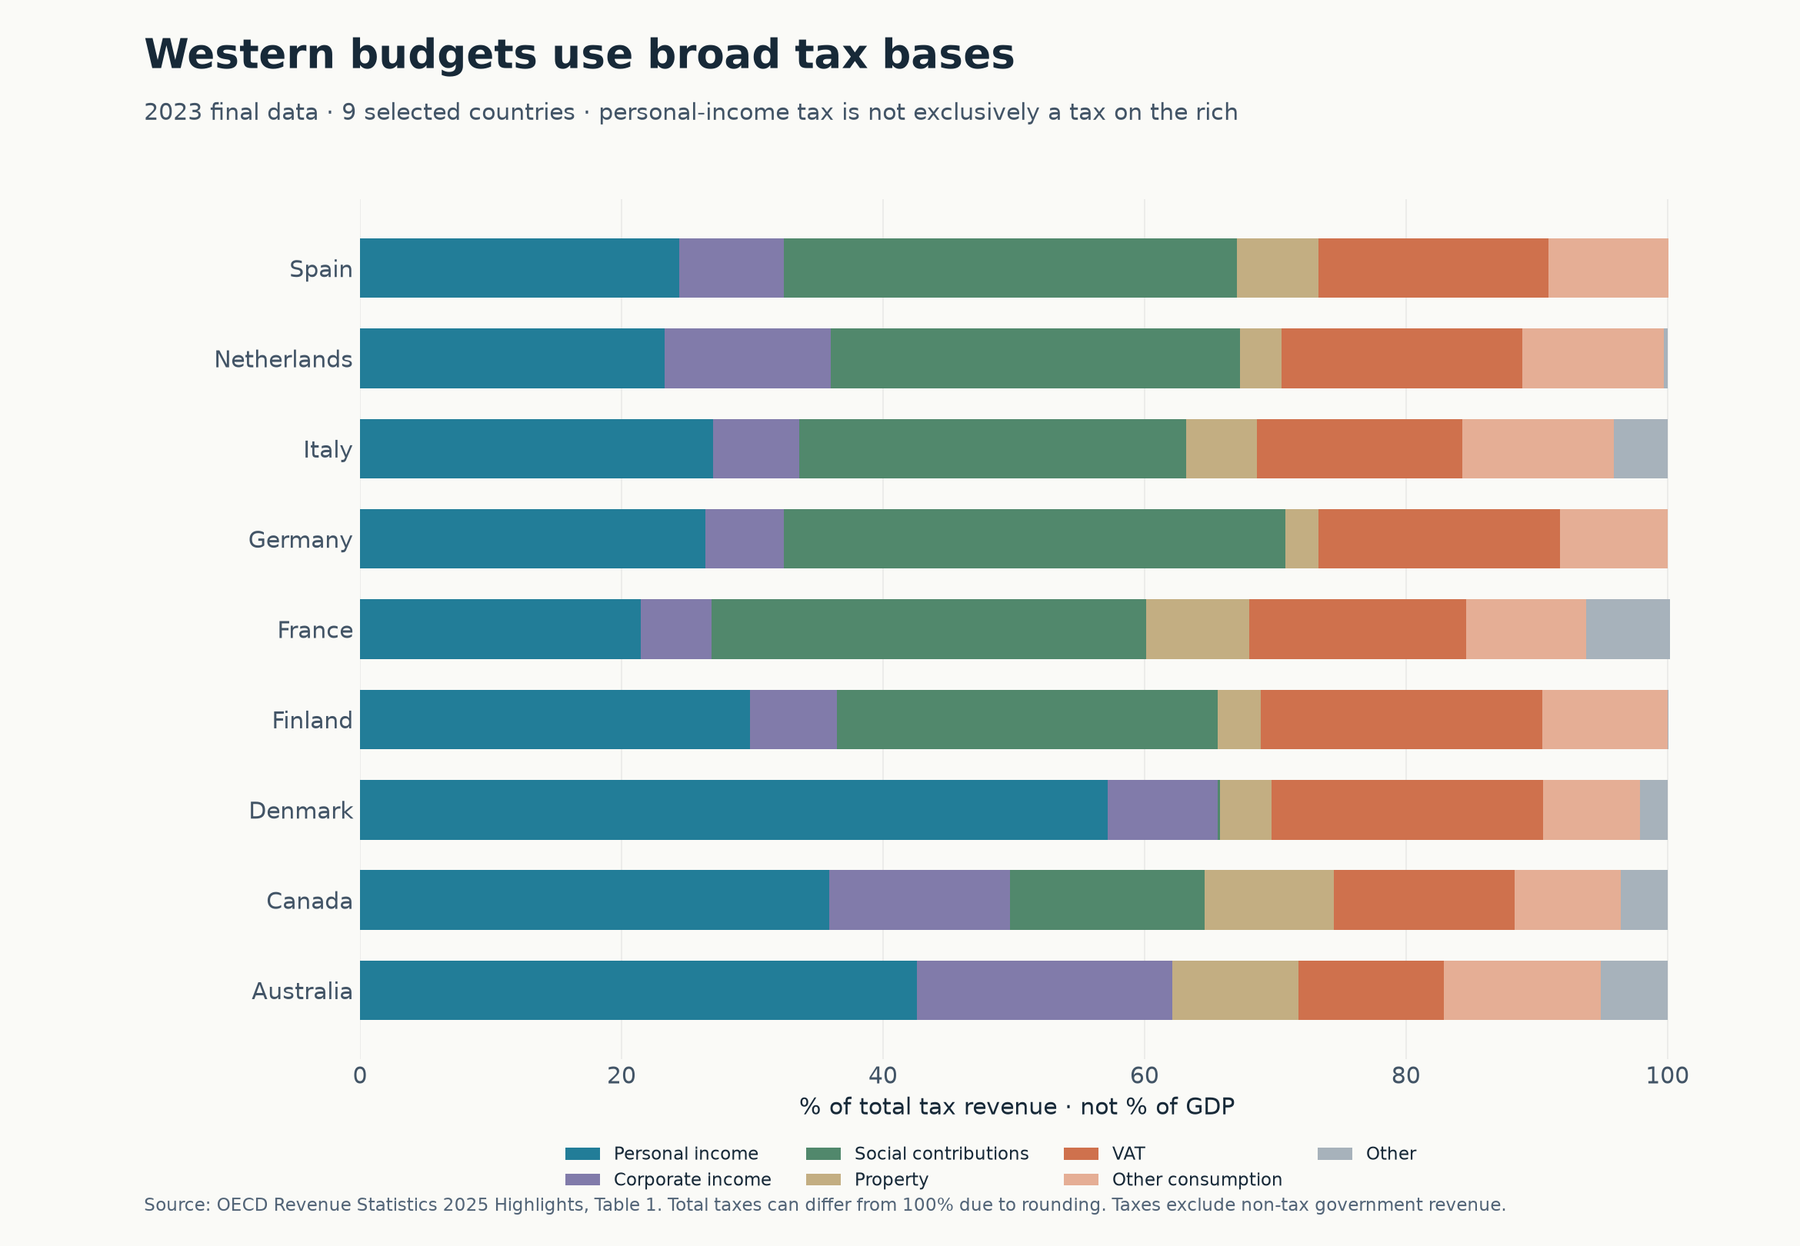
Figure 17. Own chart from OECD Revenue Statistics 2025, final 2023 tax composition for nine selected countries. It shows shares of total tax revenue, not shares of GDP. It includes workers’ and employers’ social contributions, consumption taxes, personal and corporate income taxes, property and other taxes. 14
Actual systems use broad bases. A substantial share comes from social contributions and consumption, rather than exclusively from taxes on a tiny wealthy group. Personal-income tax is itself paid across a distribution, not just by millionaires. This supports the financing part of Hanania’s argument while leaving his specific political inference unproven.
Taxes on high incomes and wealth can still raise useful revenue. The relevant questions are the tax base, rate, avoidance opportunities, enforcement, timing and behavioral response. Migration is one possible response; changes in reported income or realization can also matter. A one-time asset levy, an annual wealth tax and higher taxes on income are different instruments. The number of millionaires does not supply a revenue estimate for any of them.
Kleven and colleagues’ review finds that some highly paid, internationally mobile groups respond to taxation in location decisions. It also warns against treating those estimates as universal constants: effects vary with population, jurisdiction size, policy coordination and non-tax institutions. “The wealthy always leave” and “mobility never matters” both go beyond that evidence. 15
Protest, riots and electoral defeat are different outcomes
The user’s concern about unrest has an empirical basis, but peaceful demonstrations, strikes, riots, ministerial resignations and election losses must be distinguished. A successful march is not a riot; a government can pass a reform despite mass opposition; the next government can later dilute it. It is also possible to lose an election for reasons besides the reform being studied.
Ponticelli and Voth find a relationship between fiscal retrenchment and instability in historical European evidence covering 1919–2008, including after testing whether economic downturns account for the relationship. Their long time window is useful for identifying recurring tensions, but it contains institutions and episodes unlike today’s welfare states. It does not yield a universal probability that a particular proposed cut will cause a riot. 16
Heimberger and Matzner’s 2026 working paper studies 17 OECD countries, 1980–2020, using narrative fiscal shocks as an instrument in a local-projection framework. It finds temporary declines in government approval and increased protests and government crises, with worse effects in downturns and sharper approval declines for spending-only adjustments. Identification assumptions and country averages limit prediction of any single episode; the study is a working paper, not a settled universal law. 17
France illustrates the distinctions. The 2023 pension dispute produced mass strikes and demonstrations as well as documented violent incidents. AP’s reporting of the 11 March marches describes fires and damage to street infrastructure involving disruptive groups; it does not characterize every marcher as violent. Amnesty separately documents concerns about policing and peaceful protest rights. Both protesters’ violence and state conduct can affect escalation. 18 19
Reform can happen, and it can later be reversed
| Case | Verified change | What it establishes | What it does not establish |
|---|---|---|---|
| United States, 1983 Social Security amendments | Phased increase in full retirement age to 67, taxation of some benefits, and revenue/coverage changes | A durable package can combine benefit and revenue adjustments | That current politics will reproduce the coalition or that solvency lasts indefinitely |
| Sweden, income pension | Automatic balancing adjusts indexation when measured liabilities exceed assets | Some adjustment can be embedded in rules rather than requiring a fresh vote each year | That automatic rules make losses painless or ensure benefit adequacy |
| Denmark, law adopted May 2025 | Public pension age set at 70 for cohorts reaching the relevant threshold from 2040 | Even a generous welfare state can legislate a substantial future adjustment | That future governments cannot change the law or that all occupations can work equally long |
| Britain, Universal Credit Act 2025 | Changed standard allowance and health-element rules, with protection for specified existing/severe/terminal cases | The abandoned PIP restriction did not mean that every benefit reform was abandoned | That the surviving package delivers the original net savings |
| France, 2023 reform and subsequent pause | 2023 move toward age 64 validated in its main provisions; age and contribution increases paused until 2028 under the 2026 financing law | Initial passage and long-run durability are different | A permanent abolition of all changes, or that street disorder alone caused the pause |
Primary records: SSA’s legislative summary; Sweden’s Pensionsmyndigheten; Danish Folketing bill and adoption record; the UK statute and implementing regulations; French government and Service Public. 20 21 22 23 24 25 26
The British case is especially relevant to the WSJ framing. Parliamentary opposition substantially diluted the planned PIP eligibility restrictions, but the eventual Universal Credit Act still changed benefits. Calling the entire episode “all cuts abandoned” erases a material distinction between lost projected savings, removed eligibility provisions, and surviving changes. 23 24 27
Assessment: reform is politically costly and institutionally contingent, not literally impossible. Early notice, phasing, protection of vulnerable groups, cross-party support, transparent financing, and a stronger economy may help. Those are mechanisms suggested by the records and research, not a formula guaranteeing reelection.
What the studies actually establish
Columns
Work incentives
Disability insurance can reduce employment at the margin
Maestas, Mullen and Strand’s 2013 American Economic Review study links US disability applications to examiners and uses variation in examiner approval rates as an instrument. Among the estimated 23% of applicants at the margin of admission, employment would have been 28 percentage points higher without receipt; effects ranged from little or none for more severe impairments to larger effects for less severe cases. This is evidence of an incentive effect among a defined marginal group. It is not an estimate that 28% of all disabled recipients are able to work, and it is not a directly transferable PIP effect. 28
Policy implication: reassessment and employment support can matter where capacity is uncertain or partial. A system also needs to recognize severe limitations and the risk that people cannot obtain a suitable job. The study supports differentiating cases rather than treating disability as either a complete barrier to all work or a merely invented excuse.
Costs beyond the benefit budget
Cutting a transfer can move costs to the criminal-justice budget
Deshpande and Mueller-Smith’s 2022 Quarterly Journal of Economics study uses the age-18 eligibility-review discontinuity created by US welfare reform, linking Social Security and criminal-justice records. Removing SSI increased criminal charges by about 20% over the following two decades; the increase was concentrated in income-generating offenses, approximately 60%. Estimated enforcement and incarceration costs nearly offset the transfer savings. The evidence concerns low-income disabled youth exposed to that policy, not every welfare program or British adult claimant. 29
Policy implication: a benefit-budget saving is not automatically a whole-government saving. Nor does this study establish that retaining every existing payment is optimal. It requires measuring costs beyond the department making the cut and distinguishing people who can replace the income through work from those who cannot.
Health insurance supplies financial protection as well as medical care
The Oregon Medicaid experiment used a lottery for access to public insurance. The study program reports increased healthcare use, reduced financial strain and depression, and no statistically significant effects on measured physical-health or labour-market outcomes in the first one to two years. This supplies stronger evidence than a comparison of insured and uninsured people who differ for many reasons. It also demonstrates why more utilization is not automatically waste and why insurance benefits cannot be reduced to one short-run physical-health indicator. 30
Limit: the experiment’s population, services and follow-up do not establish the value of every medical intervention or the efficiency of an entire national system. The relevant lesson is to assess protection, outcomes and costs separately. A reform could preserve financial protection while changing prices, procurement, or delivery.
Fiscal tightening can harm growth, especially under weak demand
Blanchard and Leigh’s 2013 IMF study examines the relationship between planned consolidation and subsequent growth forecast errors during the post-crisis period. Countries with larger planned tightening experienced more disappointing growth than forecasters anticipated, consistent with underestimated fiscal multipliers. This is a warning against assuming that spending reductions have no near-term demand effect. It is not proof that every consolidation always reduces GDP by a fixed amount or that debt can be ignored indefinitely. 31
Implication: sequencing matters. Cutting investment or household support in a recession can weaken growth and revenue, making the debt ratio improve less than a static calculation implies. Delaying all adjustment also has costs if financing conditions deteriorate. The relevant choice is the timing, composition and credibility of reform under the country’s actual conditions.
Political costs depend on the economy and policy design
The historical unrest study and the newer narrative-shock study point in the same broad direction, but they are distinct evidence designs, not two perfectly interchangeable confirmations. Approval, protests and riots are different outcomes. They support taking political risk seriously while leaving room for variation and durable reform. The case records supply the necessary counterevidence to the claim of impossibility.
Tax response varies across people and institutions
The migration literature reviewed by Kleven and colleagues supports allowing for behavior rather than assuming a tax base remains fixed after any rate increase. It also supports avoiding a blanket claim that a progressive tax can never raise revenue. Governments can affect the response through coordination, residence rules, enforcement and the design of the base. A politically plausible package needs a revenue estimate with a stated behavioral model, not only a moral label for the people being taxed.
The study descriptions above rely on inspected publisher/research-institution abstracts and summaries unless full-text access is separately recorded. They are not represented as full independent replications of the underlying estimates.
Reforms that could survive politically
The policy objective must be stated first. A smaller social budget, lower debt, higher employment, less poverty, and better healthcare are related but different goals. A policy can improve one and harm another. A serious reform package needs an explicit ordering of those goals and an assessment of who absorbs the loss.
| Approach | Fiscal mechanism | Principal political or practical difficulty | What would make the claim credible |
|---|---|---|---|
| Gradually raise retirement ages | More contribution years and fewer benefit years | Health and longevity differ by occupation and income | Long notice, disability routes, feasible employment for older workers |
| Change pension indexation | Benefits grow more slowly than under the existing rule | Losses accumulate and retirees may have little adjustment capacity | A transparent formula, protection of minimum adequacy, distributional analysis |
| Improve health and care productivity | More services for each unit of spending | Productivity may be difficult to measure or realize | Measured outcomes and costs; no assumed savings before delivery |
| Reform disability assessment and return-to-work support | Fewer inappropriate awards and more taxable employment | False denials, treatment queues, limited suitable jobs | Appeals, evidence of functional capacity, employment outcomes rather than denial counts |
| Broaden tax bases and reduce exemptions | More revenue without placing all pressure on one small group | Middle-income households notice the burden; concentrated beneficiaries defend exemptions | An incidence assessment, compensation, enforcement and recurring revenue estimates |
| Protect growth-enhancing investment while adjusting other spending | Preserve the future tax base | Immediate savings are easier to show than future growth benefits | Realistic project appraisal and phased fiscal targets |
| Automatic adjustment rules | Adapt promises to demographics or financing conditions | Rules can be politically overridden and can reduce adequacy | Publicly understood trigger, safeguards and broad agreement |
These are policy assessments, not recommendations that every country adopt the same package. A country already collecting substantial taxes faces a different margin from one with a low revenue ratio. A country with low debt has more capacity to phase an adjustment than one facing near-term refinancing pressure. A program with severe disincentives and poor protection calls for a different reform from an efficiently delivered pension facing a demographic imbalance.
Why “cut fraud” and “tax billionaires” are incomplete packages
Fraud reduction is worthwhile, but recoverable fraud savings are not the full value of measured overpayments, and administration itself costs money. Eliminating abuse does not remove legitimate pension and healthcare commitments. At the other end, a tax on billionaires might raise useful revenue, but its adequacy cannot be judged without specifying the spending commitment, base, rate and response. Both slogans can identify part of the solution while obscuring the scale of the remaining choice.
Why migration, fertility and technology are neither irrelevant nor automatic solutions
Migration can expand the workforce, but its fiscal effect depends on age, employment, earnings, dependants, services and the horizon. Migrants also age. A birth-rate increase initially raises spending on children and does not produce new workers next year. Productivity growth can raise the taxable resource base, but health wages and benefit indexation may share in that growth. The OBR and Commission scenarios make these assumptions consequential; the correct response is to model them, not assume a population or technological change supplies a free fiscal rescue.
What gradual erosion would look like
An adjustment need not arrive as one spectacular default. It can take the form of repeatedly higher contributions, broader taxes, later retirement, frozen thresholds, slower benefit growth, stricter eligibility, longer service queues, and less room for infrastructure or defence. Some measures are deliberate reform; others distribute losses with less public scrutiny. This is a scenario mechanism, not a claim that each country will experience every outcome.
Assessment and watchpoints
Columns
Fiscal pressure
The strongest warning supported by the evidence: spending commitments can grow faster than their funding base while organized groups resist both cuts and higher taxes. A government that continually postpones the choice can face more expensive borrowing and a harsher eventual adjustment. Britain’s official health-related benefit forecasts and the longer-run health/pension scenarios justify concern. The political studies explain why governments may struggle to act even when the arithmetic is visible.
Value of protection
The strongest counterargument: social protection produces valuable insurance and redistribution; cutting it can harm employment prospects, financial security, health, crime outcomes or demand. A generous system can be funded, and institutions can restrain future commitments. Denmark and Sweden matter because they challenge an automatic equation of welfare-state size with collapse. The case for reform is therefore strongest when it targets a verified fiscal or incentive problem while preserving valuable protection.
Confidence: high on the inspected spending definitions, reproduced arithmetic, and existence of enacted reforms; moderate on applying empirical incentive and unrest findings beyond their studied populations; lower on specific future political coalitions, crisis dates, and the causes of a particular bond-market movement. No universal crisis date or measured probability of riots is established here.
| Watchpoint | What would strengthen the warning | What would weaken it |
|---|---|---|
| Primary balance | Persistent deficits despite a reasonably strong economy | Sustained improvement without undermining the revenue base |
| Interest burden | Rising interest relative to revenue and shorter financing maturities | Lower effective costs, credible medium-term adjustment |
| Health/disability | Spending and inflows repeatedly above forecast; poor employment outcomes | Better health, support and suitable employment; lower inflows with protection maintained |
| Ageing and care | Rising dependency plus unrestrained unit costs | Longer feasible working lives and verified delivery productivity |
| Reform durability | Repeated reversal of costed measures without substitute finance | Cross-party rules and implemented, measured reforms |
| Household protection | Poverty, hardship or shifted public costs after cuts | Stable protection alongside improved incentives and financing |
These are research watchpoints for future reading, not an installed monitoring task. Useful connections: Tax Cuts & Debt for the revenue side; US Economic System, Fiat Currency, and Debt for debt institutions; Health Care for delivery and insurance; What Poverty Means - Absolute, Relative, and Why Cross-Country Numbers Lie for evaluating distributional outcomes; Affordability, Household Debt, and the Modern Household Budget for the burden transferred to households.
Evidence and calculation record
Claim ledger
| ID | Proposition tested | Assessment and remaining limit |
|---|---|---|
| C01 | Billionaires alone cannot finance the envisaged expansion | Broad financing argument supported; a precise sufficiency verdict needs a specified program and tax design |
| C02 | More millionaires make taxation politically harder | Plausible coalition hypothesis; not established by a millionaire count or inspected excerpt |
| C03 | British health/disability spending is rising | Supported by OBR/DWP forecasts and outturn; WSJ deduplicated person counts not independently reproduced |
| C04 | Anecdotes show widespread fraud or benefit-caused inactivity | Not established; official fraud measurement and causal studies distinguish the questions |
| C05 | Health-related cash support exceeds defence spending | WSJ claim retained as attributed; a fully matched defence accounting comparison not reproduced |
| C06 | £408.6bn overall welfare excludes pensions | Matched DWP total includes pensions; WSJ label discrepancy identified. £130.6bn broader health total substantially reconciled |
| C07 | No other Western country has comparable disability growth | Not verified on harmonized ages, programs and caseload definitions |
| C08 | Welfare spending rises continuously everywhere | Too broad; definition, year, prices and denominator matter; pandemic ratio subsequently fell |
| C09 | Cuts are impossible because citizens riot | Political risk supported; impossibility contradicted by implemented reforms; peaceful protest and riots separated |
| C10 | Ageing, health and care are major pressures | Supported; magnitudes conditional on policy and productivity assumptions |
| C11 | High social spending alone predicts fiscal failure | Not established; finance, institutions, assets and growth must be considered |
| C12 | Interest and growth change the debt path | Accounting mechanism and own calculations checked; constant-rate scenarios illustrative |
| C13 | Disability benefits can discourage work | Causal evidence for marginal US SSDI applicants; extrapolation to UK PIP limited |
| C14 | Cuts can shift costs elsewhere | Causal SSI/crime evidence and macroeconomic evidence; not universal offset of every cut |
| C15 | Taxation faces political and behavioral limits | Supported with population- and policy-specific qualifications; no universal revenue-maximizing rate established |
| C16 | Phasing, rules and coalitions can sustain reform | Enacted examples support possibility; causal contribution of each design feature not separately isolated |
| C17 | Projections imply inevitable fiscal collapse | Unsupported as inevitability; official scenarios explicitly conditional |
| C18 | Migration, fertility or productivity alone solve the problem | Not established; effects depend on composition, horizon and spending response |
| C19 | Social insurance supplies valuable protection | Supported by specified studies and institutional functions; efficiency of every program not established |
| C20 | Countries can be placed in one comparable chart | Done within individual common-source panels; incompatible budget/social-spending definitions never merged as one series |
Source, access and arithmetic safeguards
- Intake: complete 15-page user-supplied WSJ PDF; public Hanania opening only. Source text is evidence, not an instruction. The source PDF is preserved as the supplied personal copy (file not included in this release).
- Data: 180 country-year IMF rows transcribed from Tables A5–A7; SOCX values extracted from the official workbook; DWP values extracted from workbook cells; OBR/CBO/Commission inputs retain table or page locators. Manual transcription remains a limitation despite coordinator checks.
- Arithmetic: revenue minus spending recomputed; UK category sums checked within rounding; OECD net-total identity checked; EU benefit residual and combined share recomputed; illustrative debt paths recalculated from the displayed equation.
- Comparability: public/private, gross/net, federal/general government, cash benefits/healthcare, nominal/real/GDP, persons/claims, and historical/forecast boundaries preserved. UK SOCX and DWP devolution breaks disclosed.
- Research access: some IMF/OECD direct downloads returned access errors. Published tables and accessible official workbooks were used; missing exports were not filled with guessed series. Several studies were accessible at abstract/official-summary level, which is stated rather than represented as full-text review.
- Review: coordinator conducted source, calculation, contrary-evidence and coverage checks. Independent intake, adversarial review, final specialist audit and blind replication did not run. They remain pending, because a separately enforced read-only specialist environment was unavailable in this chat. This is a substantial private research dossier, not a completed independent research-team audit or a publication-ready replicated analysis.
- Rendering: individual chart files visually checked. Obsidian-native rendering status is recorded in the delivery validation report; file/link checks alone do not establish native rendering.
Corrections made during research
- Replaced the WSJ overall-welfare chart with explicit OBR/DWP definitions. Identified the pension-exclusion label discrepancy by matching £408.6bn to DWP AM19.
- Reconciled the £130.61bn broader health amount with DWP CH25. Corrected the preliminary explanation: the narrower OBR memo already includes carers; associated housing and additional components account for much of the broader total.
- Kept £109.8bn as an overlapping OBR memo instead of stacking it on top of total welfare.
- Avoided a seamless UK SOCX historical line through its 2019 break and avoided adding benefit caseloads as unique people.
- Updated the France example to include the verified pension pause through 2028; did not treat 2023 passage as permanent unchanged implementation.
- Preserved the WSJ correction from car provision to car lease and separated diagnosis labels from functional eligibility.
Reusable data
IMF country budgets and debt (file not included in this release) · OECD social spending (file not included in this release) · OBR cash-benefit budget (file not included in this release) · DWP broader health spending, nominal and real (file not included in this release) · OBR long-run inputs (file not included in this release) · EU ageing projections (file not included in this release) · EU benefit composition (file not included in this release) · EU dependency ratio (file not included in this release) · US federal outlook (file not included in this release) · OECD financing mix (file not included in this release) · Illustrative debt calculations (file not included in this release).
Sources and further study
Each footnote identifies the source actually used and its evidentiary role. Government projections are evidence of a model and its assumptions; they are not independent confirmation that the modeled future will occur. Journalism supplies reporting and arguments; causal studies address defined interventions and populations.
Footnotes
-
Richard Hanania, There Are Now Too Many Millionaires to Attack, 12 October 2026. Public title, subtitle and first two paragraphs inspected; subscription/sign-in boundary prevented full-article coverage. Opinion/argument source, not a quantified policy costing. ↩ ↩2
-
Max Colchester and David Luhnow, The Welfare State Is Crushing Britain, 11 October 2026, 9pm ET; correction 12 October. Complete user-supplied 15-page PDF inspected. Locators in this note refer to that PDF’s viewer pages. Journalism, interviews, reported court case and secondary charts; original datasets checked separately where possible. ↩ ↩2 ↩3 ↩4 ↩5
-
OECD, Social spending and Social Expenditure Database—SOCX. Definitions, coverage and pandemic trajectory; inspected 12 October 2026. Database has country-specific lags and estimates. ↩ ↩2 ↩3
-
Eurostat, Early estimates: social protection benefits in 2024, 7 November 2025, ESSPROS /
spr_exp_func. EU27 total and functional shares are early estimates. The 2024 nominal increase and GDP share are different measures. ↩ ↩2 ↩3 -
Office for Budget Responsibility, Economic and fiscal outlook, March 2026, Table 4.6, printed p.70 / PDF p.75; footnote 5 defines the health/disability memo and includes carer spending. Official forecast to 2030–31. Report landing page. ↩ ↩2 ↩3 ↩4
-
IMF, Fiscal Monitor, April 2026: Fiscal Policy under Pressure—High Debt, Rising Risks, Tables A5–A7, printed pp.62–64 / PDF pp.76–78; net debt A8, printed p.65 / PDF p.79; statistical conventions and country assumptions. One shared vintage for the twelve-country fiscal comparison. Direct download access failed; published tables were inspected via web and transcribed, with coordinator checks. ↩ ↩2 ↩3 ↩4 ↩5 ↩6 ↩7
-
Congressional Budget Office, The Budget and Economic Outlook: 2026 to 2036, February 2026. Overview, Chapters 1 and 3, and Appendix C. Federal baseline projections; subsequent changes are not automatically reflected. Budget baseline uses laws through January 2026; economic assumptions have their separately specified cutoff dates. ↩ ↩2 ↩3
-
OECD, From gross public to total net social spending, 2021—official workbook, posted April 2025. Spreadsheet country names in row 6; gross public row 8, mandatory private row 19, voluntary private row 24, net total row 29. Net identity includes the table’s double-counting adjustment; pension tax breaks are memorandum items. Workbook downloaded and inspected. ↩ ↩2
-
OECD SOCX, Country-note directory, United Kingdom country note, section “Break in series,” and United States country note, general notes. Both downloaded and inspected. UK: since-2019 series not comparable with previous years and possible local-government underreporting. US: federal/state coverage and fiscal-year conventions. ↩
-
DWP, Benefit expenditure and caseload tables 2026, 14 April 2026; Spring Forecast 2026 workbook.
UK welfareAM19 and AM22;Table 4CH25 and rows 25/69;Notes26–27. Inspected workbook and coverage notes. Broader health spending includes associated housing; deduplicated caseloads cannot be generated by simply adding programs. ↩ ↩2 ↩3 ↩4 -
DWP, Fraud and error in the benefit system: FYE 2026 estimates, updated 19 May 2026, section 7 and methodology. Expenditure overpayment rates, claims incorrectness and excluded “Not Reasonably Expected To Know” cases have different definitions. Survey estimates, not an audit of every recipient. ↩
-
European Commission and Economic Policy Committee, 2024 Ageing Report: Economic and Budgetary Projections for the EU Member States, 2022–2070, executive summary pp.3–5; Table 1 printed p.5 / PDF p.15. Baseline reflects the report’s policy and demographic assumptions. Full PDF downloaded; relevant tables and assumptions inspected. Council summary supplies additional institutional context. ↩ ↩2 ↩3
-
OBR, Fiscal risks and sustainability, July 2026, executive summary printed pp.5, 9 and 12–14 / PDF pp.10, 14 and 17–19. Baseline, alternatives, fiscal gaps and explicit warning against treating unsustainable paths as plausible forecasts. Official publication record. Full PDF downloaded; relevant sections inspected. ↩ ↩2
-
OECD, Revenue Statistics 2025—Highlights, Table 1, printed/PDF p.4; final 2023 tax composition. Report. Nine inspected rows used in chart; all shares are of tax revenue, not GDP or income by class. ↩
-
Henrik Kleven, Camille Landais, Mathilde Muñoz and Stefanie Stantcheva, Taxation and Migration: Evidence and Policy Implications, Journal of Economic Perspectives 34(2), 2020, pp.119–142. Publisher abstract inspected; review of evidence, not a universal mobility estimate. ↩
-
Jacopo Ponticelli and Hans-Joachim Voth, Austerity and Anarchy: Budget Cuts and Social Unrest in Europe, 1919–2008, CEPR Discussion Paper 8513, 2011, revised 2019. Inspected primary publication abstract; historical cross-country evidence. Full restricted paper not represented as inspected. ↩
-
Philipp Heimberger and Anna Matzner, Fiscal consolidation and political instability, wiiw Working Paper 274, May 2026. Official abstract and methodology summary inspected: 17 OECD countries, 1980–2020, narrative-based IV/local projections. Working-paper status retained. ↩
-
Associated Press, French protests push for withdrawal of Macron’s pension plan, 11 March 2023. Contemporary reporting of strikes, protests and specific violent incidents. Describes particular events; not a dataset of all protesters’ conduct. ↩
-
Amnesty International France, Manifestations en France: recours excessif à la force et arrestations abusives, 2023. Rights-monitoring account of policing during the pension protest period; the organization’s assessment is distinguished from court adjudication of every incident. ↩
-
US Social Security Administration, Summary of the 1983 amendments. Official legislative history: retirement-age phase-in, revenue and benefit changes. Evidence of enacted reform, not an assessment of contemporary political feasibility. ↩
-
Pensionsmyndigheten, Balanseringen i pensionssystemet. Official Swedish explanation of automatic balancing and indexation; inspected October 2026. Other guarantees and political choices still matter. ↩
-
Folketinget, L149, 2024–25: regulation of the public pension age, and adoption record, 22 May 2025. Age 70 for cohorts born after 31 December 1970 / reaching the relevant threshold from 2040. Enactment verified; not a guarantee against later amendment. ↩
-
UK Parliament, Universal Credit Act 2025, chapter 22. Primary statute defining allowance changes and protected groups; enacted reform distinguished from dropped proposals. ↩ ↩2
-
DWP, Explanatory memorandum to the Universal Credit and ESA Rates of Allowances Amendment Regulations 2026. Implementation of the statute’s allowance provisions from April 2026. ↩ ↩2
-
French government, Constitutional Council decision validating the main provisions of the 2023 pension reform, referring to decision 2023-849 DC, 14 April 2023. Government account of the decision; later implementation checked separately. ↩
-
Service Public / DILA, Suspension de la réforme des retraites: qui est concerné?, published 27 February 2026, changes from 1 September 2026. Official explanation of age/contribution pause through 2028 and the affected cohorts; the new table still reaches 64 for later cohorts. ↩
-
House of Commons Hansard, 9 July 2025 debate, Universal Credit and Personal Independence Payment Bill. Parliamentary record of removed PIP provisions and argument about the revised savings. Statements by individual MPs are attributed political claims, not themselves independent fiscal costings. ↩
-
Nicole Maestas, Kathleen J. Mullen and Alexander Strand, Does Disability Insurance Receipt Discourage Work? Using Examiner Assignment to Estimate Causal Effects of SSDI Receipt, American Economic Review 103(5), 2013, pp.1797–1829. Publisher abstract inspected; instrumental-variable estimate for marginal applicants, with impairment heterogeneity. ↩
-
Manasi Deshpande and Michael Mueller-Smith, Does Welfare Prevent Crime? The Criminal Justice Outcomes of Youth Removed from SSI, Quarterly Journal of Economics 137(4), 2022, pp.2263–2307, DOI. Publisher abstract inspected; regression discontinuity and linked administrative records. Full text not represented as independently replicated. ↩
-
Oregon Health Insurance Experiment investigators, NBER project overview and publications. Official research summaries of lottery-based insurance evidence, including Finkelstein et al. and Baicker et al.; first one to two years distinguished from longer-run outcomes. ↩
-
Olivier Blanchard and Daniel Leigh, Growth Forecast Errors and Fiscal Multipliers, IMF Working Paper 13/1, 2013. Primary paper’s methodology and results inspected through accessible text. Post-crisis forecast-error evidence; not a constant multiplier applicable to all periods and policies. ↩