⬅️ Hub: China · Previous: Taiwan · Next: China - COVID-19
Industrial scale, economic conditions, trade, purchasing power, technology, and headline achievements.
Counterpoint: output, welfare, and misallocation
Frank Dikötter’s political-economy critique argues that China’s factories, infrastructure, and export capacity are real, but do not by themselves establish broad household prosperity or efficient investment. The note separates GDP target-gaming, statistical fabrication, and real-but-low-value output; it also preserves counterarguments about infrastructure benefits, productivity, technological upgrading, and sector-specific competitiveness.
Original notes
- Overtaken the U.S.
- 2004: China manufactoring value added was HALF of the US
- 2024: It is now 2x
Achievements
- Largest producer of EV vehicles
- Largest Navy
Economy
- Entry into the World Trade Organization in 2001 fueled rapid economic growth.
- 2008: Passed U.K, Germany, Japan
- 2008 Economic Crisis in U.S. signal to China: U.S. on the decline, China on the rise
- $1 Trillion of U.S. debt
- Chinese property sector crisis (2020–present) - Wikipedia
- China Unemployment Rate
- China is raising its retirement age in response to aging workforce and declining population | PBS News
- China’s Working Age Population Peaked - Business Insider
Trade Wars with U.S.
2017
- “Pursuing a protectionist economic policy is like locking oneself in a dark room. While wind and rain may be kept outside it also blocks the light and air. No one will emerge as the winner in a trade war.” -Xi Jinping 2007 at Davos (Aimed at President Trump)
- Trump said to Xi, “I don’t blame you, I blame us.”
- Trump wanted to stop the flawed strategy of cooperation and engagement.
- Stop IP Theft
- Forced theft by saying you have to give secrets to do business
- Lies about access to their economy
- Copy your product, do it cheaper due to subsidies, they close you out of domestic market and then dump it onto the international market
- “wolf warrior” diplomacy to counter Trump’s rhetoric
- Took the mask off, no more concealing their true ambitions
- 10% Tariff on aluminum
- 30% on solar panels & electric cars
- 25% on steel and nearly everything else made in China
- China moved it exports to other countries and move imports to other countries
- China put equal amount of tariffs on U.S.
- Increased trade deficit, lead to decline of manufacturing jobs in U.S.
Purchasing Power Parity (PPP) Comparison: China vs United States
🧮 What is PPP?
- Purchasing Power Parity (PPP) measures the relative value of currencies by comparing the price of a standard basket of goods and services between countries.
- It adjusts for differences in cost of living and inflation rates, giving a better sense of the real size of an economy than just exchange rates.
📈 Latest PPP GDP Figures (as of 2024 estimates)
| Country | GDP (PPP) in USD | Global Ranking |
|---|---|---|
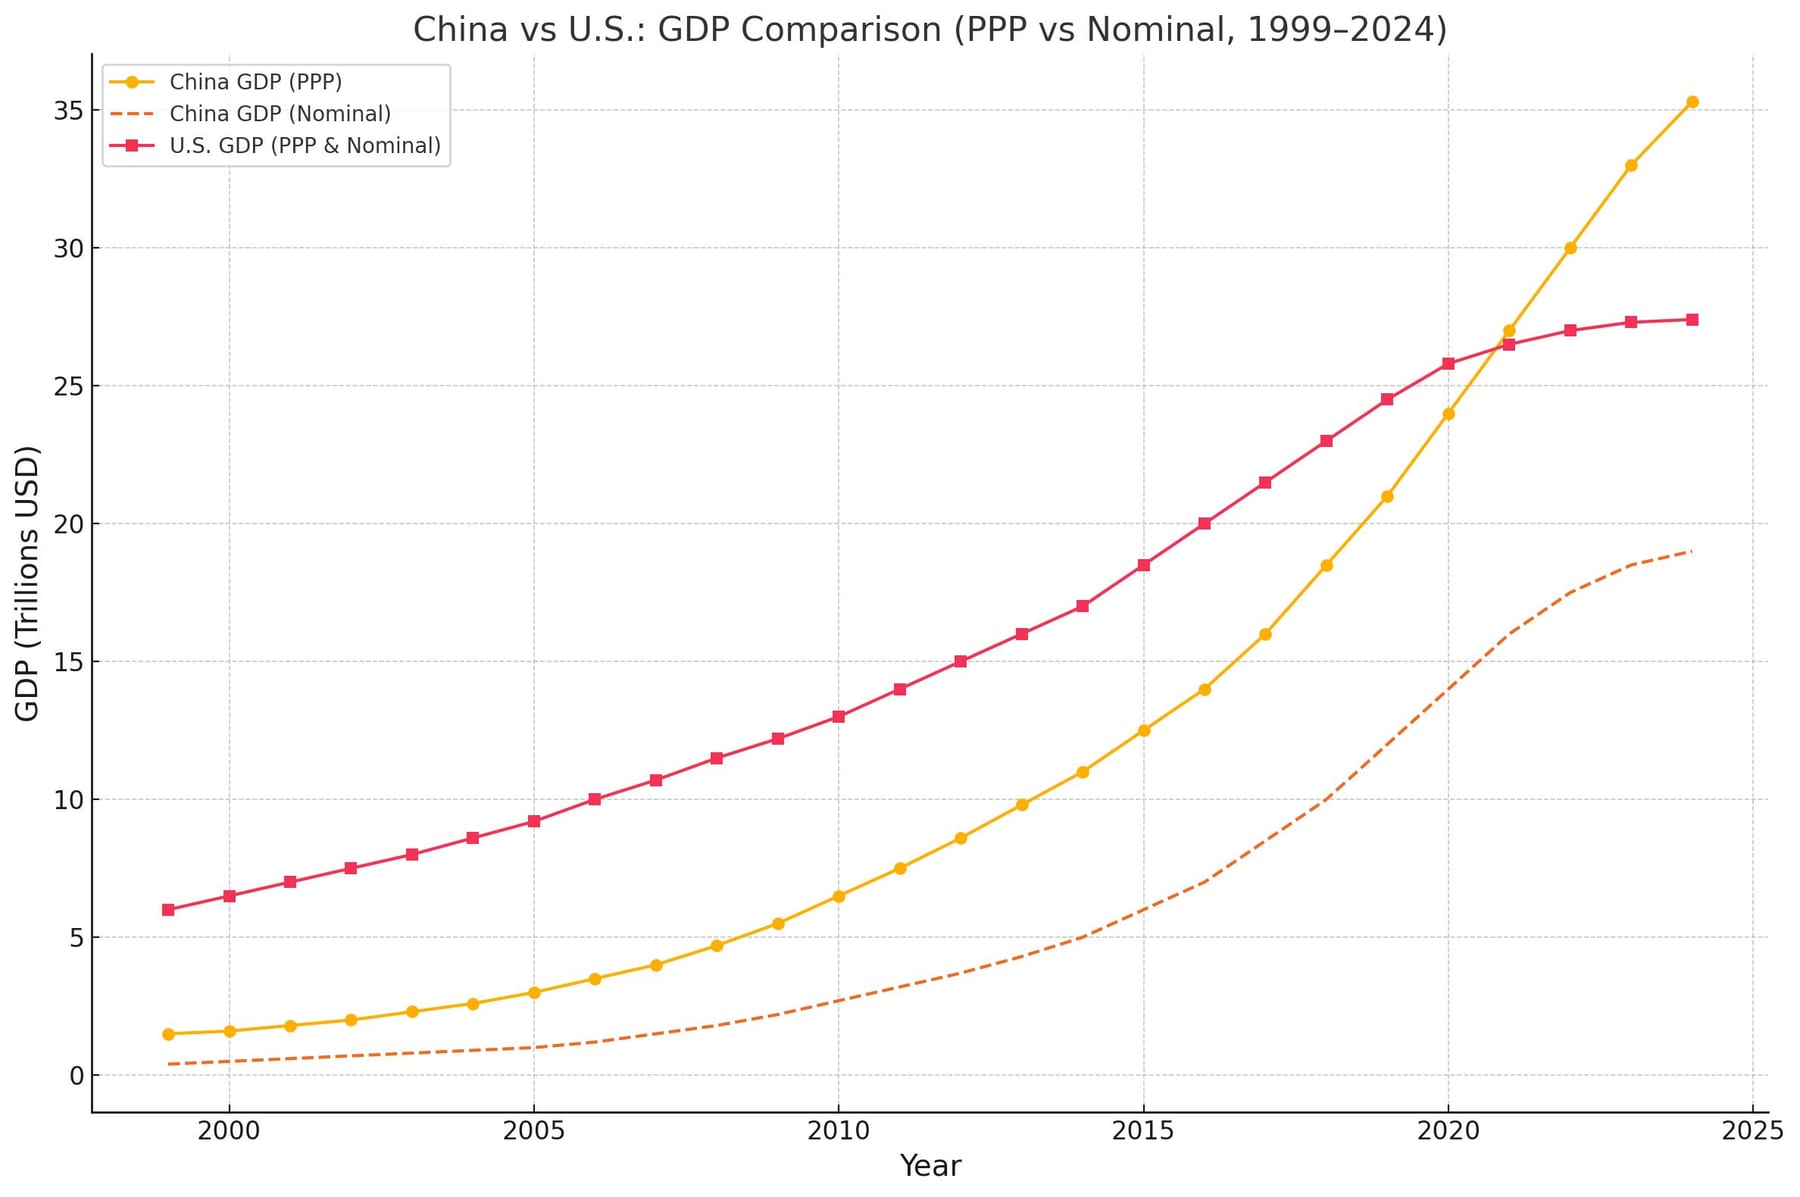
| China 🇨🇳 | ~$35.3 trillion | 1st |
| United States 🇺🇸 | ~$27.4 trillion | 2nd |
Sources:
- World Bank - PPP GDP
- International Monetary Fund (IMF) - World Economic Outlook Database
➡️ By PPP, China is already the largest economy in the world.
🧠 Per Capita GDP (PPP)
| Country | GDP (PPP) Per Capita | Global Ranking |
|---|---|---|
| China 🇨🇳 | ~$25,500 | ~68th-75th |
| United States 🇺🇸 | ~$80,000 | Top 10 |
- U.S. citizens are still much wealthier individually compared to Chinese citizens, despite China’s total PPP GDP being larger.
- China’s per capita income is comparable to middle-income countries, not developed Western nations yet.
📚 Why is China’s PPP GDP higher than nominal GDP?
- Nominal GDP (using exchange rates) shows China’s economy as smaller because the yuan is cheaper relative to the dollar.
- PPP GDP shows China as bigger because goods and services cost much less inside China compared to the U.S.
- E.g., A haircut might cost $5 in China but $25 in the U.S.
➡️ PPP reflects “how much stuff” people can actually buy with their money domestically.
- E.g., A haircut might cost $5 in China but $25 in the U.S.
🛒 Example Price Differences
| Item | Typical Price China (USD equiv.) | Typical Price U.S. (USD) |
|---|---|---|
| Coffee (Starbucks) | ~$3.50 | ~$5.00 |
| Apartment Rent (city) | ~$500–$800/month | ~$1,500–$2,500/month |
| Gasoline (per gallon) | ~$4.20 | ~$3.50–$4.00 |
| Basic Mobile Plan | ~$10–$20/month | ~$50–$70/month |
➡️ Daily living costs are much lower in China — except for cars and electronics, where China often pays similar or higher prices.
🧩 Important Caveats
- PPP is theoretical — it helps economists compare standards of living and real output, but it’s not what you feel when trading currencies.
- PPP does not mean China’s economy is “richer” than the U.S. in technology, productivity, or global financial influence.
- U.S. dollar dominance in international trade, finance, and high-end services (finance, tech, military) is still unmatched.
📊 Quick Summary
| Metric | China 🇨🇳 | United States 🇺🇸 |
|---|---|---|
| Total GDP (PPP) | ~$35.3 trillion | ~$27.4 trillion |
| GDP per capita (PPP) | ~$25,500 | ~$80,000 |
| Global economy ranking (PPP) | 1st | 2nd |
| Cost of living | Much lower | Higher |
| Individual wealth | Much lower | Much higher |