Project context
Research hub · Crime-statistics chain · Crime and homicide references · Relevant method
Closest comparison: Why Is Black America Like That
- Video: Why Is Per Capita Impossible For Them?
- Transcript source: YouTube automatic English captions, retrieved 2026-09-02
- Research status: Full transcript, screenshot audit, denominator analysis, and primary-source fact-check completed 2026-09-02.
- Overall verdict: Mixed — the basic lesson is sound, but the principal race-and-crime application does not survive its own denominator standard.
Executive verdict
The video is right about an important elementary point: a raw count and a per-capita rate answer different questions. If the question is individual prevalence or risk, a denominator is indispensable. Its poisoned-apple example illustrates that correctly, and its later observation that a rate alone does not explain why a disparity exists is also correct.
The video then overgeneralizes. Per-capita population rates are not automatically the right measure for every question. Raw counts are appropriate for total caseload, budget impact, or the number of people affected; exposure-specific denominators may be better than total population for many risks; and causal questions require a design that goes beyond either counts or rates.
Most seriously, the onscreen calculation used to dismiss gang violence combines figures that are not shown to share the same unit, population, coverage, year, or missing-data rules. The 56% number closely matches the Black share of known-race homicide offenders in the FBI’s 2019 Supplemental Homicide Report, not “Black murders divided by total murders.” The gang figures are not adequately sourced. Subtracting 9% × 50% from 56% therefore produces a rhetorically neat 51.5%, but not a valid estimate unless all three inputs describe the same universe. The cited FBI report does not establish that.
Debate-safe conclusion
“Per capita” is neither irrelevant nor universally decisive. First state the estimand: total people affected, prevalence within a group, exposure-adjusted risk, or causal effect. Then select the numerator and denominator that measure that question. Basic Logic applies this principle correctly to the apple example and partly to SNAP, but not to its own homicide subtraction.
What question does each statistic answer?
| Quantity | Appropriate question | What it cannot establish by itself |
|---|---|---|
| Raw count | How many people/events are involved? What is the total caseload or fiscal burden? | Individual risk or prevalence across unequal-sized groups |
| Population rate | How common is the event within a population? | Causation; exposure-adjusted risk; individual culpability |
| Exposure-specific rate | How common is the event per relevant opportunity, person-time, trip, encounter, or other exposure? | Causation unless paired with a credible design |
| Adjusted association | Does a disparity persist after specified measured variables are held constant? | Effects of unmeasured variables; causal direction; validity of the chosen controls |
| Causal estimate | What would change under a defined intervention or counterfactual? | Broader moral judgments about a racial population |
The correct denominator follows the question. It is not chosen because it produces the most damaging racial comparison.
Claim ledger
| Timestamp | Claim | Finding | Verdict |
|---|---|---|---|
| 0:00 | With 20 poisoned apples among 1,000 versus 2 among 10, the first bag has the lower chance of poisoning. | The rates are 20/1,000 = 2% and 2/10 = 20%. For a random draw with identical stakes, Bag A is safer. | Correct |
| 0:28 | Per capita lets us look beyond raw numbers. | Rates are necessary for prevalence or risk comparisons across differently sized populations. | Correct but incomplete |
| 0:43 | Higher total GDP does not imply a richer average citizen. | Total GDP and GDP per capita measure different things. GDP per capita is still an average and not household income, distribution, or welfare. | Broadly correct |
| 1:10 | “37% of white Americans are on EBT, while 25% of Black Americans are on EBT.” | The displayed source language indicates these are approximately the racial shares of SNAP participants, not the percentages of each racial population receiving SNAP. USDA FY2018 reported roughly 35.7% of SNAP participants as non-Hispanic White and 25.1% as non-Hispanic Black. The quoted speaker reverses the conditional probability. | Misstated by the quoted speaker |
| 1:27 | More White people would be affected in raw numbers if benefits were cut. | A policy-impact question can legitimately require the number of recipients, not only within-group participation rates. The exact number depends on the year and racial categories used. | Plausible; raw counts are relevant |
| 1:37–2:48 | People who reject per-capita comparisons are intellectually limited, biased, malicious, or selectively reasoning. | These are speculative judgments about a person, not statistical findings. A disagreement can also concern the estimand, exposure measure, data quality, or causal interpretation. | Unsupported false trichotomy |
| 2:48 | White men are 29% of the population but commit 71% of child-sex crime. | No offense definition, year, database, unit, or source appears. “Commit” cannot be inferred automatically from arrests, convictions, incarcerated persons, or victim reports. | Unverified |
| 3:08 | Per capita tells how common something is, not why it happens. | A descriptive rate measures frequency in a defined denominator; it does not identify a causal mechanism. | Correct |
| 3:16 | Controlling for poverty can be relevant to crime disparities. | Poverty can be a confounder, mediator, collider, or outcome depending on the causal question. “Control for it” is not automatically valid without an explicit model. | Correct in principle; underspecified |
| 3:31 | A person invoking another variable should explain its relevance and show evidence. | This is a good evidentiary norm, though exploratory objections can still be legitimate before a complete model exists. | Reasonable |
| 3:55 | White and Black crime track poverty similarly except for gang violence. | This claim from the embedded opponent is anecdotal and undefined. It would require comparable offense, age, sex, geography, exposure, and enforcement data. | Unsupported in the clip |
| 4:05 | Black gang violence can be “pretty easily negated” from the murder figures. | The onscreen inputs do not establish compatible denominators or datasets. Gang classification is incomplete and the cited source is too vague. | Not demonstrated |
| 4:13 | Black people are 13% of the population and account for 56% of murders. | The FBI 2019 figure is 55.9% of offenders whose race was known in supplemental homicide data. It is not 55.9% of all murders; offender race was unknown for 4,752 offenders, and the supplemental data are not the FBI’s estimated national murder total. | Mislabelled |
| 4:13 | Gang-related murders are about 9% of all murders and about half of gang murders are Black. | The frame names only “FBI 2019 Report” and “Bureau of Justice,” not a table. It does not say whether these are incidents, victims, offenders, known-race offenders, or which year/coverage applies. | Unverifiable as presented |
| 4:13 | Non-gang Black murder equals 56% − (9% × 50%) = 51.5%. | The arithmetic is correct if all shares have the same denominator: 0.56 − 0.09×0.50 = 0.515. The necessary compatibility is not established and is unlikely given the first figure’s known-offender denominator. | Arithmetically correct; statistically invalid as shown |
| 4:31–5:16 | Antonio’s editing proves bias and political commentary is not his talent. | Editing choices may be evidence in a debate-history audit, but they do not validate the homicide calculation. The insults add no evidentiary weight. | Not a fact-check |
Screenshot audit
SNAP/EBT denominator at 1:25
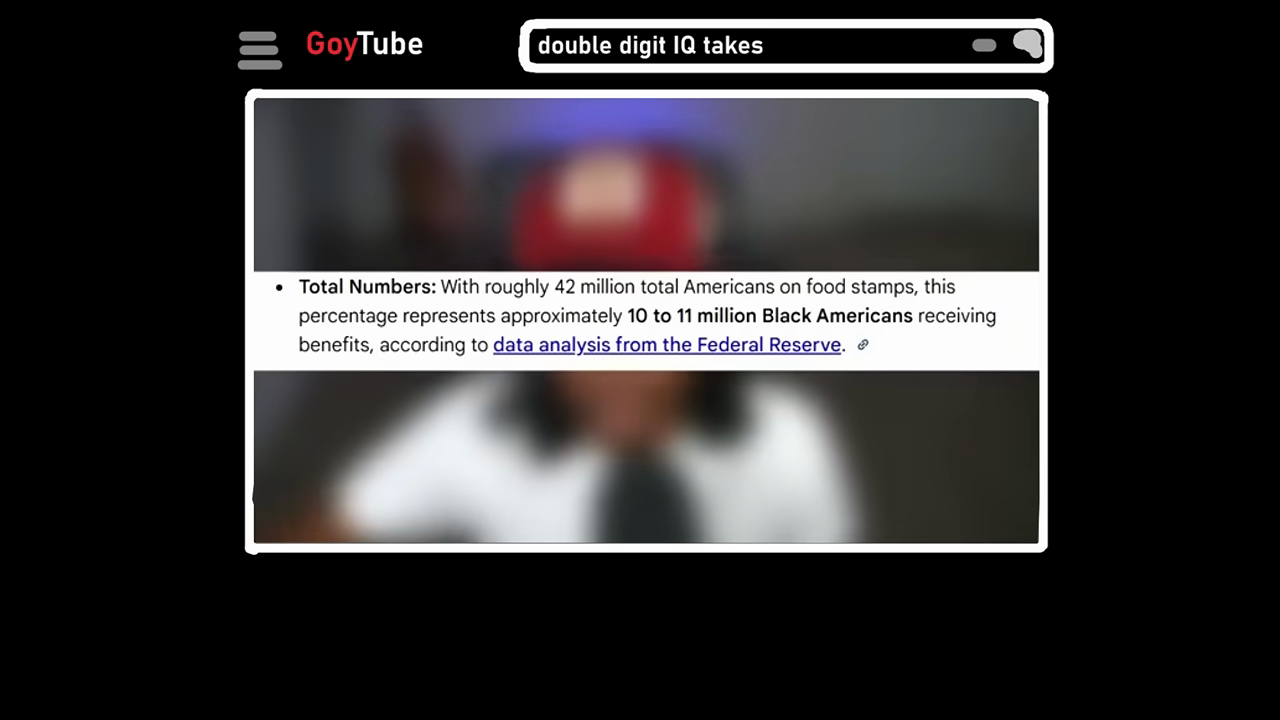
The frame itself describes 37% and 25% as portions of a roughly 42-million-person participant total. That is composition:
[
P(\text{race}\mid\text{SNAP participant}),
]
whereas “37% of White Americans are on EBT” asserts:
[
P(\text{SNAP participant}\mid\text{race}).
]
These are not interchangeable. The embedded speaker therefore states the statistic incorrectly. Basic Logic is right that within-group rates are required to compare participation prevalence, but the embedded speaker’s separate claim about the number affected by a cutoff uses a legitimate total-impact estimand.
Proposed control-variable workflow at 3:35
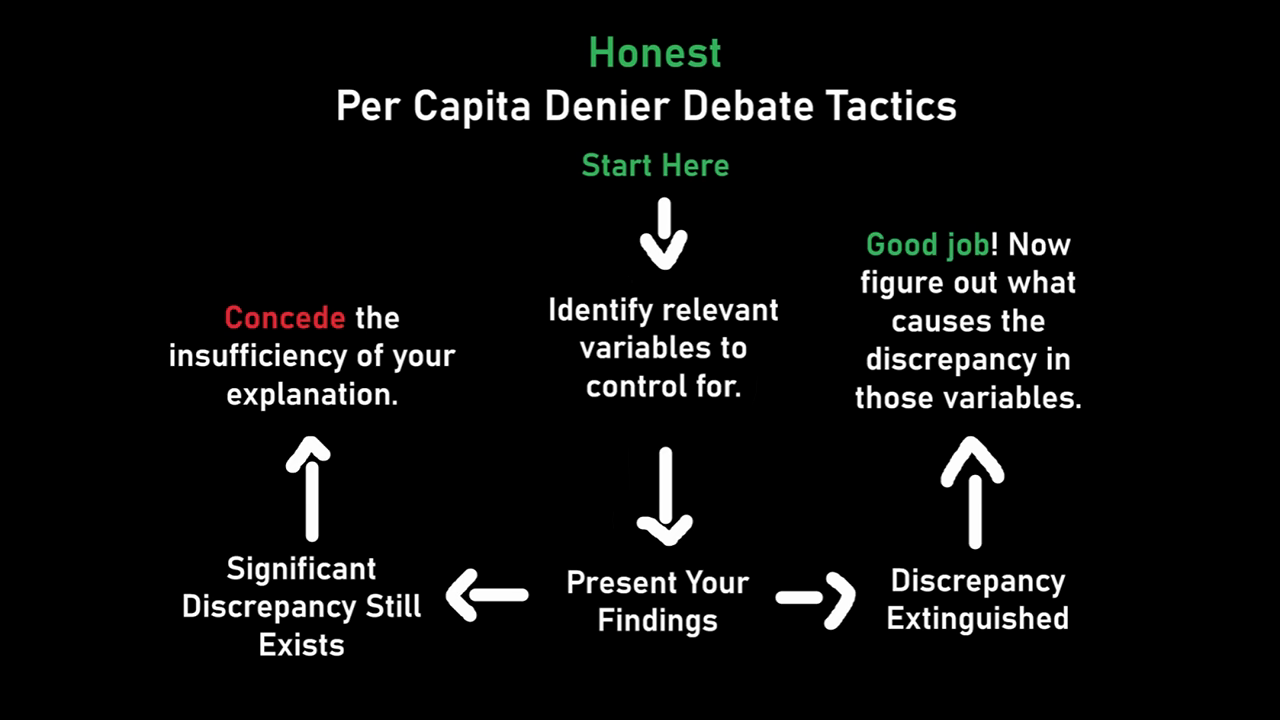
The workflow contains a useful idea—name the proposed variable, explain its relevance, and show results—but “the discrepancy persists” is not itself a causal conclusion. Adjustment is credible only when the variables, timing, sampling, model, and causal role are defensible. Controlling for a mediator can erase part of the effect one intends to study; controlling for a collider can create bias.
Homicide subtraction at 4:10
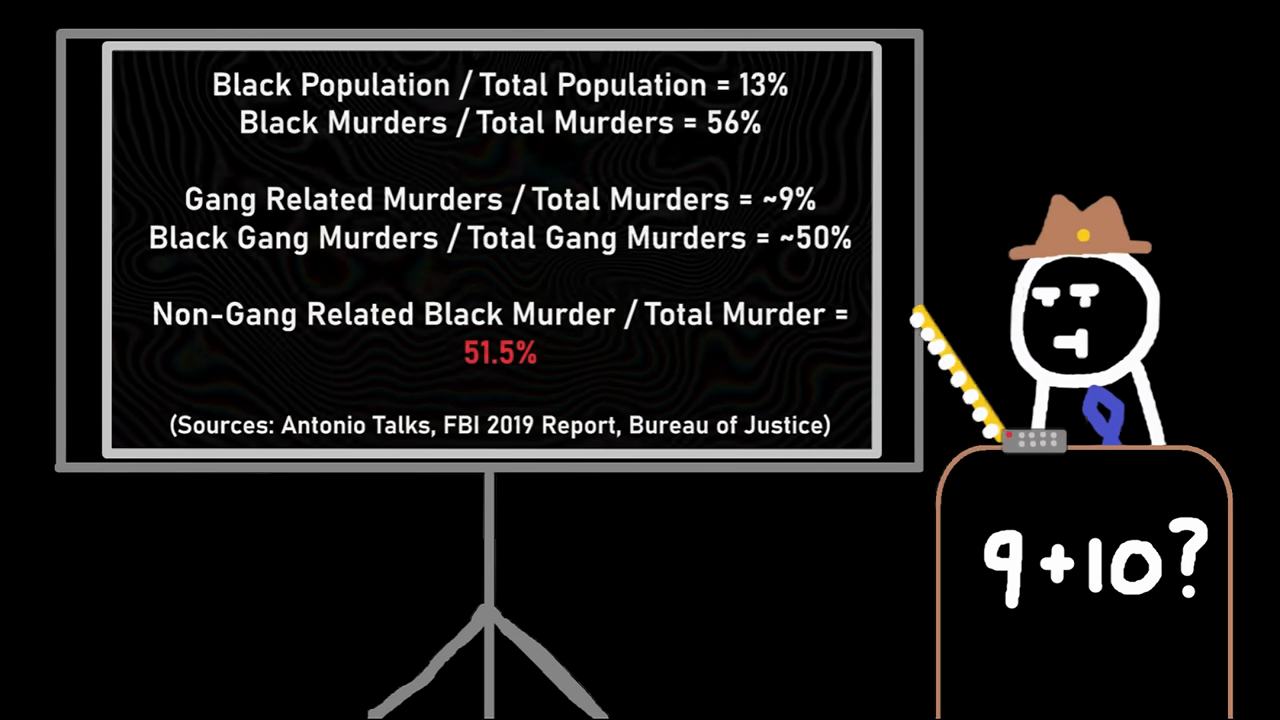
The displayed calculation is:
[
56%-(9%\times 50%)=51.5%.
]
The numerical operation is simple; the measurement model is not. For valid subtraction, the terms must all be shares of the same set—for example, all national homicide offenders in the same year, with consistent treatment of multiple offenders and unknown race, and a complete gang/non-gang classification. The frame does not document that. Its 56% aligns with a known-race-offender share, while 9% is labelled a share of murders and 50% a share of gang murders. That mixes persons and incidents unless proven otherwise.
The FBI’s 2019 expanded homicide data also report known circumstances for only 58.8% of murders in the supplemental dataset. A missing or unknown circumstance is not equivalent to “non-gang.”
Methodological errors
- Treating “per capita” as a universal trump card. A rate is appropriate only relative to a defined question and exposure.
- Confusing two conditional probabilities. Racial composition of SNAP recipients is not the SNAP participation rate within each race.
- Mixing denominators and units. The homicide slide appears to combine known offenders, murders/incidents, and gang-classified cases.
- Ignoring missingness. Unknown offender race and unknown homicide circumstances can materially affect shares.
- Equating controls with causality. Statistical adjustment is not automatically a valid counterfactual comparison.
- Jumping from a group share to individual propensity. A share of recorded offenders is not a probability that a randomly chosen person commits murder; age, sex, geography, time at risk, reporting, clearance, and enforcement all matter.
- Using ridicule as a substitute for source transparency. The most consequential numbers receive less sourcing than the opponent receives invective.
Source provenance
- The SNAP percentages resemble USDA participant-characteristic tables that circulate in political graphics. The video/embedded clip converts a participant-composition statistic into a within-race claim.
- The
55.9%figure is traceable to the FBI’s 2019 expanded homicide table for offenders of known race. Its wording has been flattened in meme and debate ecosystems into “13% commits 56% of murder.” - The exact pairing of “9% gang murders” and “50% Black gang murders” is not traceable from the frame’s generic citations. It may come from a secondary crime-statistics bundle rather than one coherent official table.
- The argument is continuous with the crime-link collection preserved in Basic Logic Youtube Channel Research > Possible reference sites supplied or identified during research: FBI tables are mixed with screenshots, reposts, and polemical interpretations, often without preserving units or denominators.
What has and has not been established
The video may have drawn from the same broader race-crime citation ecosystem under investigation. No evidence found here proves that Basic Logic copied any one Reddit post or author. The overlap is a provenance lead, not creator identification.
Cross-video connections
- Why Is Black America Like That repeats the known-offender/murder conflation, then narrows the claim to young Black men without supplying the subgroup calculation.
- The Genetics Behind Unequal Societies likewise moves from a real descriptive population difference to a much stronger causal and civilizational conclusion.
- Basic Logic Cross-Video Claim Map tracks the recurring sequence: descriptive statistic → re-labelled causal proxy → group-level generalization → moral or political conclusion.
Open questions
- What exact source and year supplied the
9%gang-related figure? - What table supplied the claim that Black people account for
50%of gang murders, and does it concern victims, incidents, arrests, or offenders? - What source, offense definition, and unit underlie the
71%child-sex-crime claim? - Was the SNAP display drawn from USDA FY2017, FY2018, or a later secondary graphic mixing years?
- Can the debate clip be recovered in full to determine whether the opponent made a narrower claim elsewhere?
Primary and methodological sources
- FBI, Crime in the United States, 2019: Expanded Homicide Data — supplemental homicide coverage, offender race, and circumstance limitations.
- FBI, 2019 NIBRS: Offenders, Race by Offense Category — shows why homicide figures cannot be generalized to “more than half of crime.”
- USDA FNS, Characteristics of SNAP Households: Fiscal Year 2018 — official participant-characteristic report behind the approximately 35.7% non-Hispanic White and 25.1% non-Hispanic Black composition figures.
- Bureau of Justice Statistics, Homicide Victimization in the United States, 2023 — current national victimization estimates and methodology.
- Federal Committee on Statistical Methodology, A Framework for Data Quality — relevance, accuracy, coherence, and transparency principles applicable to denominator selection.
Full transcript
Full transcript (YouTube automatic captions; lightly normalized)
Automatic captions can mishear names, numbers, and punctuation. The wording below is retained as evidence of what the video appears to say, not as authentication of every proper noun or statistic.
0:00 — Let me ask you a question. There are two bags of apples. Bag A has 1,000 apples, 20 of which are poisoned. Bag B has 10 apples, two of which are poisoned. Gun to your head, you’re forced to eat one apple. From which bag are you choosing? If you chose bag B, congratulations. Your ancestors somehow dodged every form of natural selection since the start of our species. The concept I’ve just illustrated is per capita, literally meaning per person, or in this case per apple. A very useful tool which allows us to look beyond just raw numbers and actually see what this means for people in practice. The fact that there are 20 poison apples in bag A does not mean your chances of being poisoned are higher. Likewise, just because your country’s raw GDP is higher, doesn’t mean your average citizen is richer than in a country with lower GDP. Unfortunately, this fifth grade math tool seems to be too
1:00 — difficult for some. Here’s an example. >> Listen, listen. Everybody always talks about per capita, per capita. I know what per capita is. But in my opinion, per capita is irrelevant. Let me explain why. Even going to the EBT situation, 37% of white Americans are on EBT, while 25% of black Americans are on EBT. Now, with that being said, 37% of white America >> I’m not sure exactly. I’m going to put the numbers up. >> versus 25% of black America. That’s around 10 million. Disregarding per capita, white Americans would be affected more if EBT was cut off. White America benefits off OF EBT MORE. MORE WHITE people are on EBT. >> There are three possible explanations for this phenomenon. Option one, intellectual limitation. Per capita is not hard, but it does require one layer of abstraction. If their intuition is insufficient and they have to calculate, it would require holding two different numbers, dividing them, and interpreting the outcome. This is just too much for some people, especially preschoolers. Now, as fun as it would be for me to end
2:01 — the video here just calling people stupid, that’s not the full picture. Option two, bias. Perhaps they are able to grasp per capita. They just don’t want to in a given situation because it would undermine their argument. Now, this option subdivides. Either the individual is fully aware that he’s ignoring per capita and he’s doing it out of malice to deceive his audience. Or the individual is usually capable of grasping per capita, but when the raw numbers exist that seemingly confirm his preconceived notions, he doesn’t think about it. In that case, it’s still an intellectual limitation, just not as severe as being unable to understand per capita. We can test if someone’s option two. If someone uses per capita when it helps them, but calls it misleading when it doesn’t, that’s not confusion. That’s selective reasoning. >> Might I add another stat? White men make up 29% of American population, but commit 71% of the child, you know what,
3:01 — crime. >> Option three, they want to control for other variables. This is the only legitimate objection. Per capita doesn’t explain why something happens. It just tells you how common it is. A regular occurrence is wanting to control for poverty when analyzing crime disparities. Be wary though, there’s a difference between we need more variables to understand this better and per capita is useless unless it explains everything. The simplest way to discover someone’s actually raising a valid argument is if they actually go ahead and try to control for the variables they’re citing and present their findings. And if they can explain why those variables are relevant. If they can’t and are just using those variables as excuses to disparage the per capita stat, then they’re being dishonest. >> When I was a police officer, I noticed that white crime and poverty go together like black crime and poverty. Only difference is gang related violence, which make black people go up another notch. Right, right. >> Did you catch it? He brought up another
4:02 — variable and pulled a just trust me. We can pretty easily negate black gang [music] violence. On screen are the actual stats. As you can see, white crime and black crime are not similar even without gangs. For those of you have been keeping up with the channel, you know that another YouTuber, Antonio Talks, and I have had a back and forth after he made a quote debunking of one of my videos, where she just showed his inability to interpret statistics, namely per capita. I don’t really know which option Antonio falls under. It’s definitely not option three. If I had to guess, he falls under option two, bias. I think the strongest evidence for this was his strategic choice to cut out almost my entire response video in his rebuttal, starting exactly from where I start talking about statistics, which implies he knows he’d look bad if he showed that to his audience. Per capita isn’t an opinion. It’s just simple division. Listen, I
5:03 — don’t want to bully someone for being mathematically challenged. Everyone has their own unique talents. I hope Antonio finds his because political commentary is definitely not it.