Bottom line
When you control only for income or poverty, majority-Black neighborhoods often still show higher recorded violent crime or gun homicide rates than majority-white neighborhoods at the same broad socioeconomic level. But that answer is incomplete because “income” is a weak control. It misses wealth, segregation, housing vacancy, family disruption, institutional investment, school quality, police deployment, density, age-sex structure, social networks, gang markets, and historical disinvestment.
When you control for broader concentrated disadvantage, the Black-white gap in neighborhood violence becomes much smaller, sometimes statistically weak, and the effect of poverty/disadvantage is usually larger than the effect of racial composition itself. In other words: extreme disadvantage predicts violence more powerfully than neighborhood race alone.
Also, “which neighborhoods commit more crime?” is not quite the right wording. Neighborhood data usually show where crimes are reported, where victims live, or where homicides occur, not necessarily where offenders live or which residents “commit” them.
Pinker’s Chapter 3 historical supplement — the racial homicide gap was not constant
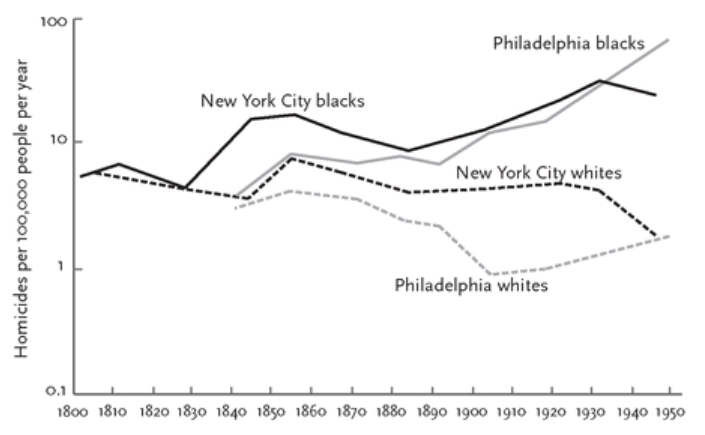
Pinker uses Randolph Roth and other historical reconstructions to argue that the modern Black–white homicide disparity was not an unchanging feature of American history. In the series he plots for New York and Philadelphia, Black and white within-group homicide rates were closer in the early nineteenth century and diverged later; he says similar early parity appears in New England, the Midwest, and Virginia. Pinker treats the timing as evidence against a biological explanation and points instead toward the aftermath of slavery, segregation, concentrated disadvantage, hostile or unreliable policing, and “effective statelessness,” in which residents rely on retaliatory honor codes because law is distrusted or unavailable.
Figure 3-14 — reconstructed Black and white homicide rates in New York and Philadelphia, 1797–1952. This is a sparse historical compilation with shifting jurisdictions, categories, record quality, and adjustments; it charts within-group homicides in two cities, not contemporary offending, victimization, or every racial pairing. It cannot apportion causation among segregation, poverty, policing, migration, illicit markets, and neighborhood institutions. Its strongest contribution is historical: a disparity that opens and changes over time requires a historical and institutional explanation. Chapter 3 synthesis · Pinker’s contemporary disparity framing and measurement claims, PDF pp. 147–148 (file not included in this release) · Figure 3-14 and its data adjustments, PDF pp. 151–152 (file not included in this release) · Pinker’s historical and institutional interpretation, PDF p. 152 (file not included in this release)
1. The most direct poor-white vs poor-Black comparison: victimization data
The Bureau of Justice Statistics looked at violent victimization by poverty level using the National Crime Victimization Survey. This is useful because it includes crimes reported and not reported to police.
For 2008–2012:
| Group | Violent victimization rate |
|---|---|
| Poor whites | 46.4 per 1,000 |
| Poor Blacks | 43.4 per 1,000 |
| Poor Hispanics | 25.3 per 1,000 |
| Poor urban whites | 56.4 per 1,000 |
| Poor urban Blacks | 51.3 per 1,000 |
BJS explicitly says there was no statistically significant difference between whites and Blacks at each poverty level in violent victimization rates. It also found that poor urban Blacks and poor urban whites had similar violence rates.
So if the question is:
Among poor individuals or poor households, are poor Blacks more violently victimized than poor whites?
The BJS answer is: not really; poor whites and poor Blacks look similar in violent victimization rates.
But this is victimization, not offending. It tells us who is exposed to violence, not who commits it. The NCVS does collect offender characteristics from victims’ perceptions, but the BJS poverty report cited here is mainly about victimization exposure, not offender rates.
2. Neighborhood crime studies: poverty explains a lot, but not all
A classic study by Ruth Peterson and Lauren Krivo examined white and Black census tracts in Columbus, Ohio and compared crime rates across levels of neighborhood disadvantage.
Their core finding: disadvantage matters more than race, especially for violent crime. Extremely disadvantaged neighborhoods had much higher violence than low-disadvantage neighborhoods. For example, neighborhoods with extreme overall disadvantage had violent crime rates 16.3 per 1,000 higher than low-disadvantage areas.
When they compared similarly disadvantaged white and Black communities, they found some remaining Black-white differences in violent crime, but those differences were usually smaller than the differences caused by disadvantage itself. They write that extremely poor Black tracts had violent crime rates about 6 per 1,000 higher than extremely poor white tracts, while the low-to-extreme poverty gap within both white and Black neighborhoods was much larger: 16–17 per 1,000.
Their conclusion is important:
A large part of the racial difference in violence is due to whites and Blacks living in structurally different communities; however, the measured disadvantage variables did not explain every remaining difference.
So if the question is:
Among equally poor white and Black neighborhoods, which has more violent crime?
The best answer from this classic neighborhood study is:
Black neighborhoods had somewhat higher violent crime rates at the same broad poverty/disadvantage level, but the race gap was smaller than the disadvantage gap. Extremely poor white neighborhoods looked more like extremely poor Black neighborhoods than like non-poor white neighborhoods.
For property crime, the answer is even less favorable to a simple racial explanation. Peterson and Krivo found that property crime rates in similarly disadvantaged Black tracts tended to be somewhat lower than in white tracts, and racial gaps in the effects of disadvantage on property crime were not statistically significant.
3. National neighborhood evidence: majority-Black neighborhoods have higher average violence, but because the neighborhoods are not comparable
Peterson and Krivo later expanded this into the National Neighborhood Crime Study, covering nearly 9,000 neighborhoods in 87 U.S. cities. Their book Divergent Social Worlds found that African American neighborhoods had violent crime rates averaging about five times those of white neighborhoods. But the same source emphasizes that white and Black neighborhoods are not similarly situated: more than 90% of white neighborhoods had low poverty, while only about one quarter of Black, Latino, and minority neighborhoods did.
That means the raw per-capita comparison is not an apples-to-apples comparison. It is partly measuring race, but also measuring:
- concentrated poverty
- segregation
- weak local investment
- weaker institutional supports
- housing instability
- vacancy
- lower neighborhood wealth
- lower political and market responsiveness
The Russell Sage summary of the book says the authors show how housing-market inequities produce segregation and spatial inequality, which then undermine local social control and foster criminal violence.
So the raw national pattern is:
Majority-Black urban neighborhoods have much higher recorded violent crime than majority-white urban neighborhoods on average.
But the controlled interpretation is:
Much of that gap reflects the fact that majority-white and majority-Black neighborhoods are structurally different environments, not merely different racial populations.
4. Gun homicide: Black neighborhoods remain higher even at similar socioeconomic status
A 2020 JAMA Network Open study looked specifically at gun homicide deaths by census tract from 2014–2018, using Gun Violence Archive data and American Community Survey socioeconomic data. It compared neighborhoods by racial composition while holding a deprivation index constant. That deprivation index included poverty, median household income, education, health insurance, public assistance, SNAP, and vacant housing.
The finding: majority-Black neighborhoods had higher gun homicide rates than mostly white neighborhoods at the same socioeconomic status level. The Penn summary says that among middle-class neighborhoods, gun homicide rates were more than four times higher in mostly Black neighborhoods than mostly white neighborhoods.
This is one of the stronger pieces of evidence for the claim:
Controlling for socioeconomic status does not eliminate the neighborhood race gap in gun homicide.
But again, that does not prove that Black residents are inherently more criminal. The authors point to mechanisms such as residential segregation, racial wealth gaps, underinvestment, and fewer institutional resources.
Also, gun homicide is a narrow subset of crime. It should not be generalized to all crime, property crime, fraud, domestic violence, drug crime, or white-collar crime.
5. Why “income control” is too weak
The major methodological problem is that “income” is not the same as social ecology.
Two neighborhoods can have the same median income but differ sharply in:
| Variable | Why it matters |
|---|---|
| Wealth | Home equity, savings, inheritance, business ownership, emergency buffers |
| Residential stability | Stable residents increase informal social control |
| Vacancy | Empty lots/buildings are associated with disorder and crime opportunities |
| Age-sex structure | Crime is heavily concentrated among young males |
| Institutional density | Churches, schools, rec centers, businesses, after-school programs |
| Police legitimacy | Cooperation affects clearance rates and deterrence |
| Segregation | Determines exposure to other disadvantaged areas |
| Network disadvantage | Whether residents’ daily movements connect them to other high-risk areas |
| Informal social control | Adults’ capacity to supervise public space |
| Illegal markets | Drug/gang conflicts create retaliatory violence |
| Prior violence | Violence is path-dependent; retaliation cycles matter |
The National Academies report makes this point through the concept of triple disadvantage: a neighborhood can be poor, visited by people from other poor neighborhoods, and have residents who themselves travel mostly to other poor neighborhoods. Black neighborhoods are far more likely than white neighborhoods to experience this compounded disadvantage; the report says Black neighborhoods are over 35 times more likely than white neighborhoods to have triple disadvantage.
That matters because a “poor white neighborhood” and a “poor Black neighborhood” may have similar poverty rates but very different surrounding networks, institutional environments, and exposure to nearby violence.
6. So which commits more crime after controlling for income?
The careful answer:
If you mean
violent victimization among poor people
Poor whites and poor Blacks have similar violent victimization rates, and BJS found no statistically significant Black-white difference at each poverty level. Poor urban whites were actually slightly higher than poor urban Blacks in that dataset, but the difference should not be overinterpreted.
If you mean
recorded violent crime in neighborhoods
Majority-Black neighborhoods often show higher recorded violent crime than majority-white neighborhoods even at similar poverty levels, but the gap shrinks substantially once broader disadvantage is included. Peterson and Krivo found that extremely poor Black tracts had violent crime rates about 6 per 1,000 higher than extremely poor white tracts, while poverty/disadvantage differences within each race were much larger.
If you mean
gun homicide
Majority-Black neighborhoods appear to have higher gun homicide rates than majority-white neighborhoods at comparable socioeconomic status, including in the 2014–2018 tract-level JAMA Network Open study.
If you mean
property crime
The evidence is weaker for “Black neighborhoods commit more.” In the Peterson/Krivo Columbus study, similarly disadvantaged Black neighborhoods tended to have somewhat lower property crime than white neighborhoods, and race differences were not statistically significant.
If you mean
actual offender behavior by residents
The data are much harder. Arrest data are not the same as offending data, neighborhood incidents are not the same as resident offending, and victim surveys depend on victims’ perceptions of offender race. The NCVS does collect offender information, including race and Hispanic origin, but it is not designed to cleanly answer “which neighborhood residents commit more crime” by neighborhood racial composition and income.
7. The best synthesis
A defensible synthesis would be:
Poor white and poor Black individuals experience similar levels of nonfatal violent victimization. At the neighborhood level, majority-Black neighborhoods tend to have higher rates of serious violence and gun homicide than majority-white neighborhoods even after controlling for income or broad socioeconomic status, but the race gap is much smaller than raw comparisons suggest and is heavily mediated by concentrated disadvantage, segregation, institutional underinvestment, vacancy, and social isolation. Extreme poverty makes white neighborhoods much more violent too; extremely disadvantaged white neighborhoods resemble extremely disadvantaged Black neighborhoods far more than they resemble affluent white neighborhoods.
So the answer is not:
“Race explains crime.”
It is closer to:
“Concentrated disadvantage explains a large share of violence; because concentrated disadvantage is racially distributed in the U.S., majority-Black neighborhoods experience much higher average violence. Some residual Black-white neighborhood gaps remain after simple income controls, especially for gun homicide, but income alone is an inadequate control.”
Sources for Obsidian
- Bureau of Justice Statistics — Household Poverty and Nonfatal Violent Victimization, 2008–2012
- Bureau of Justice Statistics — National Crime Victimization Survey methodology
- Peterson & Krivo — Extremely Disadvantaged Neighborhoods and Urban Crime
- Russell Sage Foundation — Divergent Social Worlds: Neighborhood Crime and the Racial-Spatial Divide
- National Academies — Reducing Racial Inequality in Crime and Justice, Chapter 3
- JAMA Network Open — Neighborhood Racial Composition and Gun Homicides
- Penn Today summary of the JAMA study