Pinker’s Chapter 7 supplement — official discrimination and overt racial attitudes
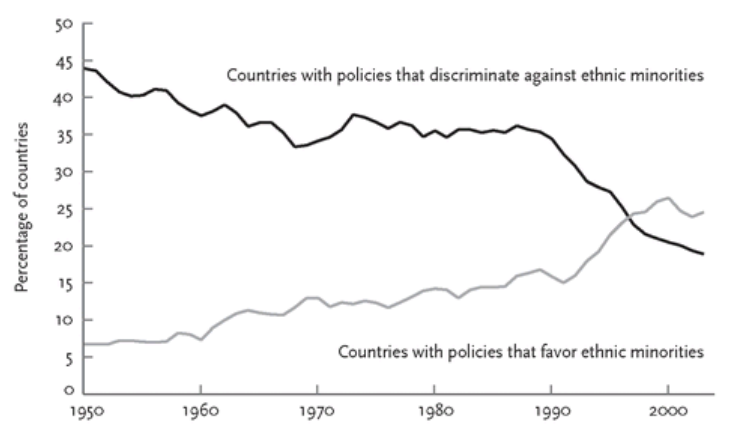
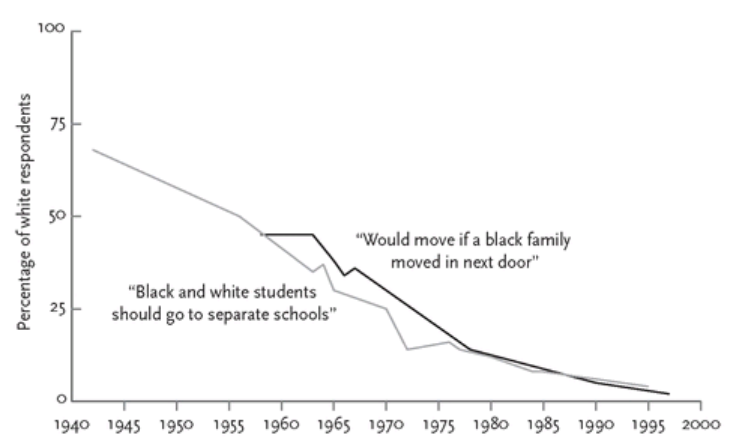
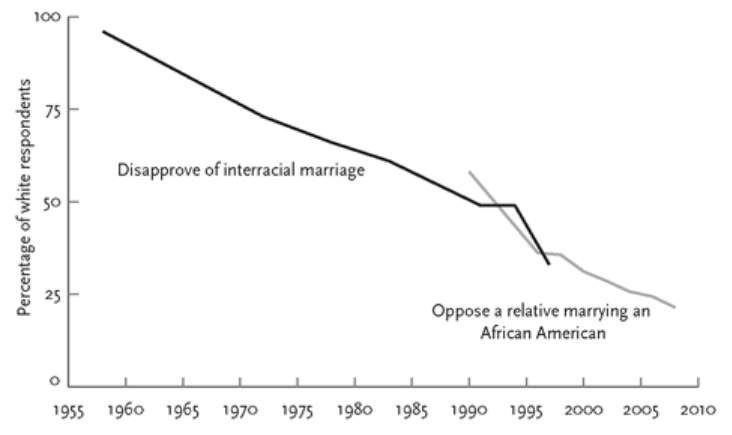
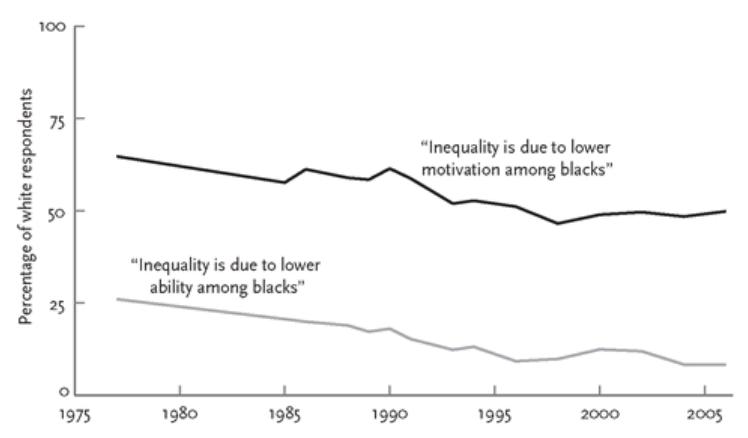
Pinker uses two different evidentiary layers. A cross-national historical dataset tracks whether governments formally disadvantaged or favored ethnic minorities; U.S. polls track explicit attitudes about segregation, interracial marriage, and stereotyped explanations of inequality. Together they support a retreat from overt legal hierarchy and openly stated prejudice. They do not by themselves measure present-day structural inequality, implicit bias, discriminatory behavior, or the quality of relations between groups.
Figures 7-5 to 7-8 — State policy and white U.S. racial attitudes, 1942–2008. Figure 7-5 summarizes 337 ethnic minorities in 124 countries: governments with discriminatory policies fell from about 44% in 1950 to 19% in 2003, while remedial policies rose. The coding concerns official policy toward a recorded minority, not every form of inequality, and regional aggregates conceal large differences. Figures 7-6 and 7-7 show steep declines in support for separate schools, residential avoidance, and opposition to interracial marriage. Figure 7-8 is more mixed: the “lower ability” explanation falls toward single digits, while the “lower motivation” response remains near half. Question wording, social-desirability pressure, sample design, and changing norms all matter. These historical series complement rather than replace newer polling in this note. Chapter 7 synthesis · Government policy and attitude evidence, PDF pp. 544–549 (file not included in this release) · Figure 7-5, PDF p. 545 (file not included in this release) · Figures 7-6 and 7-7, PDF p. 546 (file not included in this release) · Figure 7-8, PDF p. 548 (file not included in this release)
The history of race relations polling in the United States reflects a long effort to gauge public perceptions of racial dynamics, shaped by pivotal historical events and evolving social attitudes. Polling organizations like Gallup, Pew Research Center, and Rasmussen Reports have tracked these sentiments since the 1930s, providing a lens into how Americans view relations between racial groups—particularly Black and white populations—and when significant shifts, including notable drops, occurred. Below, I’ll outline the trajectory of this polling, pinpoint key declines, and critically assess the data, drawing from my knowledge base up to March 6, 2025, and relevant sources.
Early Polling (1930s–1950s): Emergence and Optimism
- Origins: Gallup began polling on race-related issues in 1939, with 57% of Americans supporting Eleanor Roosevelt’s protest against the Daughters of the American Revolution for barring Black singer Marian Anderson—a rare early snapshot (Gallup, Web ID: 4). Systematic race relations polling didn’t solidify until the 1950s, amid civil rights stirrings.
- Key Question: By 1948, Gallup asked about race as the nation’s “most important problem,” with 9% citing it during Truman’s desegregation orders (Web ID: 14). Polling was sporadic, focusing on specific events rather than consistent trends.
- 1950s Spike: In 1957, 27% named race as the top issue during the Little Rock Nine crisis, reflecting heightened awareness but not a cohesive “relations” metric (Web ID: 14). Optimism dominated—majorities assumed legal equality would resolve tensions.
No Major Drop: Data was too fragmented to show a clear decline; polling reflected event-driven spikes rather than a baseline.
1960s–1970s: Civil Rights and Sustained Focus
- Expansion: The 1960s saw sustained polling as the Civil Rights Movement peaked. Gallup’s “most important problem” metric hit highs—e.g., 52% in May 1964 post-Civil Rights Act (Web ID: 14). Questions on Black-white relations emerged, like “Will racial problems always persist?” (1963: 66% of whites said yes, vs. 44% of Blacks, Web ID: 9).
- General Social Survey (GSS): Launched in 1972, GSS began tracking attitudes on integration and discrimination, establishing long-term benchmarks (Web ID: 11).
- Trend: Perceptions fluctuated with riots (e.g., 1967) and assassinations (e.g., MLK, 1968), but no consistent “good/bad” relations metric existed yet. Optimism lingered—e.g., 1970s polls showed growing approval of interracial marriage (Web ID: 0).
No Clear Drop: Polling captured unrest, not a unified decline in perceived relations—data was event-specific, not longitudinal.
1980s–Early 2000s: Optimism Peaks Under Bush
- Gallup’s Modern Metric: By 2001, Gallup standardized the question: “Would you say relations between whites and Blacks are very good, somewhat good, somewhat bad, or very bad?” From 2001–2013, 63%-72% rated relations “good” (Web ID: 9), peaking at 72% in 2004 under George W. Bush (Web ID: 0, X post by @larryelder ).
- Context: Post-Cold War stability, economic growth, and lower racial flashpoints (e.g., post-LA Riots recovery) fueled this high. Polls like NBC/WSJ (1988) found 55% calling society racist, but relations weren’t explicitly “bad” (Web ID: 7).
- Critical Note: This peak may reflect white optimism more than Black experience—Black respondents consistently rated relations lower (e.g., 63% “good” in 2001 vs. 70% for whites, Web ID: 9).
No Drop Yet: The early 2000s marked a high watermark, not a decline—drops came later.
First Major Drop: 2014–2016 (Obama’s Second Term)
- Shift: Positive ratings fell from 70% in 2013 to 47% in 2015 (Gallup, Web ID: 9), a sharp drop tied to high-profile police killings—e.g., Michael Brown (2014), Freddie Gray (2015). By 2016, Rasmussen found 60% saying relations worsened since Obama’s 2008 election (Web ID: 10).
- Data Points:
- Gallup (2015): 47% “good,” down from 72% peak (Web ID: 9).
- PBS/Marist (2015): 68% said relations were “bad,” up from prior decades (Web ID: 2).
- NBC/WSJ (2018): 70% “bad,” vs. 70%+ “good” under Obama’s first term (Web ID: 7).
- Why: Ferguson riots, Black Lives Matter’s rise, and Obama’s polarizing racial rhetoric (e.g., Trayvon Martin comments) shifted perceptions. X posts (e.g., @larryelder , 2020) tie this drop to Obama’s second term, aligning with Gallup’s timeline.
- Critical Note: Polling may overstate the drop—white perceptions soured more (8-point decline 2018-2020) than Black (4 points, Web ID: 9), suggesting media amplification of unrest skewed views.
Second Drop: 2020 (Post-George Floyd)
- Plunge: Gallup’s June-July 2020 poll hit a two-decade low—44% rated Black-white relations “good” (Web ID: 9), with Black respondents at 36% vs. whites at 46%. NBC/WSJ found 26% “good” (Web ID: 7), and mentions of race as the top problem spiked to 19% (highest since 1968, Web ID: 14).
- Context: George Floyd’s killing (May 2020), nationwide protests, and COVID-19 racial disparities fueled pessimism. Pew (2019) noted 58% already saw relations as “bad” pre-Floyd (Web ID: 5), setting the stage.
- Post-Floyd: Rasmussen (2021) found 42% “good,” down from 44% in 2020 (Web ID: 8), and CNN polls showed 54% of Blacks vs. 35% of whites saying relations worsened (Web ID: 12).
- Critical Note: The drop reflects acute crisis perception, not a structural shift—57% remained optimistic about future solutions (Web ID: 8), and protest fatigue later tempered views (e.g., 42% “worse” in 2021 vs. 60% in 2016, Web ID: 15).
Recent Trends (2021–2025): Stabilization with Pessimism
- Post-2020: Gallup (2021) recorded 33% of Blacks and 43% of whites rating relations “good” (Web ID: 8), a slight rebound but still low. Rasmussen (2025) found 26% saw improvement, with 32% rating relations “poor” (Web ID: 17).
- Dobbs Effect: Post-2022 Roe v. Wade reversal, racial justice receded from focus—CNN (2021) noted it became “out of sight, out of mind” for many (Web ID: 12), stabilizing but not lifting perceptions.
- Current State: By 2025, 37%-41% see relations worsening (Rasmussen, Web IDs: 13, 18), a plateau below pre-2014 highs but above 2020 lows.
Critical Analysis
- Drops Explained: Major declines align with visible racial crises—2014-2016 (police brutality) and 2020 (Floyd)—amplified by media and social media (e.g., X sentiment post-Floyd). Yet, question wording (e.g., Gallup’s “good/bad”) may exaggerate shifts by capturing fleeting emotions, not lived reality.
- Data Gaps: Pre-2001 polling lacks consistency—Gallup’s “most important problem” (1939-2000) isn’t a direct relations metric. Non-reporting groups (e.g., rural whites, Latinos pre-1990s) skew early samples.
- Omitted Nuance: Black optimism often exceeds white (e.g., 60% vs. 54% see a solution, 2020, Web ID: 9), countering narratives of uniform despair. Economic factors (e.g., 2008 recession) or policy (e.g., Obama’s tenure) get overstated vs. cultural drivers like media framing.
Conclusion
Race relations polling began in earnest in the 1930s, matured in the 1960s, and peaked in optimism from 2001-2013 (72% “good” in 2004). Significant drops occurred in 2014-2016 (47% “good,” down from 70%) during Obama’s second term and 2020 (44% “good,” a 20-year low) post-Floyd, driven by police violence and protests. Since 2021, perceptions stabilized at a pessimistic ~30-40% “good,” per Gallup and Rasmussen. These shifts reflect event-driven spikes more than steady decline—polling’s sensitivity to crises and wording limits its depth, but the trend from optimism to caution is clear by 2025.