Project context
- Video: The IQ Debate We’re Not Allowed To Have
- Published: December 18, 2025
- Transcript source: YouTube automatic English captions, retrieved September 2, 2026
- Visual review: full video plus three preserved frames
- Description: says the video “doesn’t argue for a single explanation,” but provides no bibliography, statutory citation, country list, or chaptered sources.
- Research status: Complete first-pass fact-check. Open provenance and cross-national legal questions remain listed below.
Executive verdict
Scientifically misleading and rhetorically asymmetric. The video raises a legitimate principle—controversial hypotheses should be assessed by evidence rather than intimidation—but it does not show that genetic differences cause observed racial or national IQ gaps. Its three-way model is a false trichotomy; its national-IQ map is methodologically disputed; its Head Start slide turns short-term test-score fadeout into evidence for geneticism even though the experiment cannot make that inference; and its suppression slide mixes genuine episodes of protest and sanction with factual errors, opinion, and an irrelevant “boundary case.” Even if every suppression claim were true, suppression would not validate the genetic hypothesis.
Scope and evidence boundary
This dossier separates four questions that the video repeatedly compresses:
- Do measured mean differences exist in some samples? Yes.
- Do genes contribute to differences among individuals within studied populations? Yes.
- What causes a mean difference between socially or nationally defined groups? Not answered by questions 1 or 2.
- Are particular hypotheses socially stigmatized or institutionally constrained? Sometimes, but that is a sociology-of-science question, not genetic evidence.
The hereditarian hypothesis is not refuted merely because it is controversial. It is also not supported merely because its advocates have faced hostility.
controversy, protest, sanction, or legal restriction
                         ≠
evidence that a disputed causal hypothesis is correct
The video’s inference chain
national IQ differences are visible on a map
                    ↓
three rival explanations: structure, culture, genetics
                    ↓
structuralism is enforced; geneticism is suppressed
                    ↓
Head Start test-score fadeout weakens environmental explanation
                    ↓
persistent gaps make genetic explanation increasingly plausible
The central defect is the fourth step. A failed or incomplete intervention does not identify the cause of the problem it failed to eliminate. Head Start did not equalize all prenatal, family, neighborhood, health, school, peer, or socioeconomic conditions, and test-score fadeout does not distinguish genetic causes from persistent environmental causes.
Verdict key
- Supported: adequate evidence for the claim as stated.
- Partly supported: a narrower factual core is supported, but the wording or inference overreaches.
- Misleading: important context or level-of-analysis distinctions change the apparent meaning.
- Unsupported: the video supplies no adequate evidence and the review found no basis for the claim as stated.
- False: contradicted by primary or highly authoritative evidence.
- Value judgment / hypothesis: not directly fact-checkable without operational definitions and evidence.
Revised claim ledger
| Time / frame | Video claim | Verdict | Evidence and correction |
|---|---|---|---|
| 0:02 | A world map shows “troubling differences between populations.” | Misleading | The frame is the widely circulated country-level Lynn–Vanhanen 2002 national-IQ map. It combines heterogeneous tests, years, ages, samples, and estimated or imputed values. A country color is not a direct measure of an innate racial trait. |
| 0:06 subtitle | The map becomes more troubling “when you adjust for identity, not just nationality.” | Unsupported / visual mismatch | The displayed figure remains a map of national estimates. No identity variable, adjustment method, model, sample, or result is shown. |
| 0:11 | There are three broad explanations: structure, culture, or genetics. | False trichotomy | These are not mutually exclusive or consistently defined causes. Culture is an environmental transmission system; structures alter culture and incentives; genotypes correlate and interact with environments. |
| 0:20–0:35 | Only two explanations may be discussed; geneticism is so restricted it cannot be openly studied; debate is managed rather than resolved in a lab. | Overstated | Stigma, protests, and professional consequences are real topics. But intelligence genetics, ancestry, polygenic scores, and race/IQ arguments continue to be published. No authority could “resolve” the question in one lab because measurement, population definition, causality, and ethics are part of the problem. |
| 0:38 | Structuralism says disparities are solely products of systemic racism and oppression. | Straw man | No scholar, institution, policy, or text is cited. Structural explanations can include schooling, health, wealth, exposure, institutions, discrimination, and feedback with individual behavior; they need not say each disparity has one cause. |
| 0:46 | Poverty, biased institutions, and historical trauma cause lower IQ and bad outcomes. | Plausible mechanisms, overgeneralized | Nutrition, toxins, illness, schooling, stress, and deprivation can affect cognition and outcomes, but the magnitude varies and each claim needs a design. Treating all “structuralism” as one total theory prevents adjudication. |
| 0:55 | Structuralism removes agency and places all responsibility on an invisible system. | Value-laden straw man | Explaining constraints does not logically erase agency. Individual action and institutional causation can coexist. |
| 1:02 | Supporters cite documented discrimination and compounding intergenerational effects. | Broadly supported, not quantified here | Histories of discrimination and wealth/institutional persistence are documented. That does not by itself estimate their share of any contemporary cognitive-score gap. |
| 1:09 | Structuralism aligns with “modern neo-Marxism.” | Undefined ideological label | No definition, lineage, or cited theorist is supplied. The label substitutes political association for empirical evaluation. |
| 1:17–1:36 | Culturalism says values, family norms, education, and work attitudes drive outcomes; a bad culture produces lower IQ; assimilation is the solution. | Hypothesis bundle | Culture can influence learning and behavior, but “bad culture” is undefined. Culture is not independent of institutions, incentives, selection, discrimination, health, or material conditions. Assimilation is a policy claim, not an experimental result. |
| 1:38 | Groups that succeed despite discrimination prove the power of culture and work ethic. | Unsupported comparison | No groups, outcome, period, selection process, migration history, starting point, or discrimination measure is specified. Group comparisons require denominators and competing explanations. |
| 1:51–2:07 | Geneticism says innate cognitive and behavioral differences explain gaps and make environmental interventions limited. | Accurate description of a hypothesis; not evidence for it | Individual cognitive variation is substantially heritable in many studied populations. That statistic does not estimate the genetic cause of a group mean. |
| 2:08 | This position is illegal to research in many nations. | Unsupported and misleading | No nations, statutes, cases, or prohibited research designs are named. Germany’s Basic Law expressly protects scientific research, subject to general law. Hate-speech, privacy, ethics, or anti-discrimination rules can constrain conduct without constituting a categorical research ban. |
| 2:10 | Grants are impossible and careers are destroyed for pursuing it. | Unsourced absolute | Controversial work can incur reputational or institutional costs, but “impossible” is contradicted by continuing publication and by the video’s own examples not being grant analyses. No funding call, application, decision, or comparison rate is provided. |
| 2:08 slide | Jensen predicted Head Start would fail, was right, and was physically attacked; Watson was right about a gloomy African future; Jussim shows a gradient of punishment. | Mixed, with important errors | Jensen faced threats and disruptive protests, but his own profile said he was never physically attacked. His 1969 paper postdated Head Start’s 1965 launch and treated IQ and scholastic outcomes separately. Watson’s sanctions are real, but his racial claims were called unsupported by his own institution. Jussim explicitly is not a genetic-race-IQ advocate and remains a distinguished Rutgers professor; he cannot establish that such research is impossible. |
| 2:08 slide | James Watson is “1928–Present.” | False when published | Cold Spring Harbor Laboratory announced Watson’s death on November 7, 2025. The video was uploaded December 18, 2025. |
| 2:31 | IQ gaps persist across time, geography, and socioeconomic levels in ways culture or structure cannot explain. | Overstated and causally non-diagnostic | Some gaps persist in some datasets, but their sizes can change. Dickens and Flynn found a 4–7-point Black–white convergence in US standardization samples from 1972–2002. Persistence is compatible with persistent environments, gene–environment correlation, or genetic causes; it does not identify which. |
| 2:48 | Structure, culture, and genetics influence outcomes to some degree; the debate is which dominates. | Reasonable starting intuition, poor model | Multiple causal levels likely matter, but there is no single context-free percentage for “structure,” “culture,” or “genes.” The buckets overlap and effects vary across cohorts and outcomes. |
| 2:57 | Academia forces structuralism “down our throats.” | Unsupported generalization | No survey, curriculum, journal policy, grant pattern, or institutional sample is offered. Strong rhetoric replaces a measurable claim. |
| 3:05 | Groups facing greater visible obstacles outperform groups with visible advantages, contradicting structuralism. | Unspecified and non-diagnostic | Without named groups and controls for migration selection, age, wealth, education, family structure, geography, health, and measurement, no causal conclusion follows. |
| 3:18 slide | Head Start had state-of-the-art facilities, billions, every possible advantage, sometimes vastly outcompeted private alternatives, yet IQ gains vanished by grades 3–4; even “perfect educational conditions and unlimited resources” did not raise IQ. | Short-term fadeout partly true; framing false | The federal impact study found initial benefits and few statistically detectable impacts by grade 3, but many controls used other preschool and the program was heterogeneous—not perfect, unlimited, or a clean genetic experiment. Longer-term studies find gains in education, earnings-related outcomes, health, or reduced criminal involvement despite test-score fadeout. |
| 3:25 | Structural explanations depend on invisible, unfalsifiable forces that cannot be measured or reformed. | False generalization | Income, school quality, pollution, disease, neighborhood, family resources, discrimination, and policy exposure can all be measured imperfectly and studied with longitudinal, experimental, quasi-experimental, sibling, and natural-experiment designs. |
| 3:31 | Weak structural and cultural explanations plus suppression radicalize people toward geneticism. | Plausible sociological hypothesis, unsupported here | A backlash mechanism is possible, but no survey, experiment, longitudinal data, or comparative evidence is supplied. |
| Description vs. visuals | The video “doesn’t argue for a single explanation.” | Misleading framing | The narration nominally permits a mixed model, but the slides say Jensen and Watson “were right,” call Head Start a decisive failure of structuralism, and ridicule structural explanations as “ghosts.” The presentation is not neutral among the three models. |
Visual and source audit
1. The opening world-IQ map
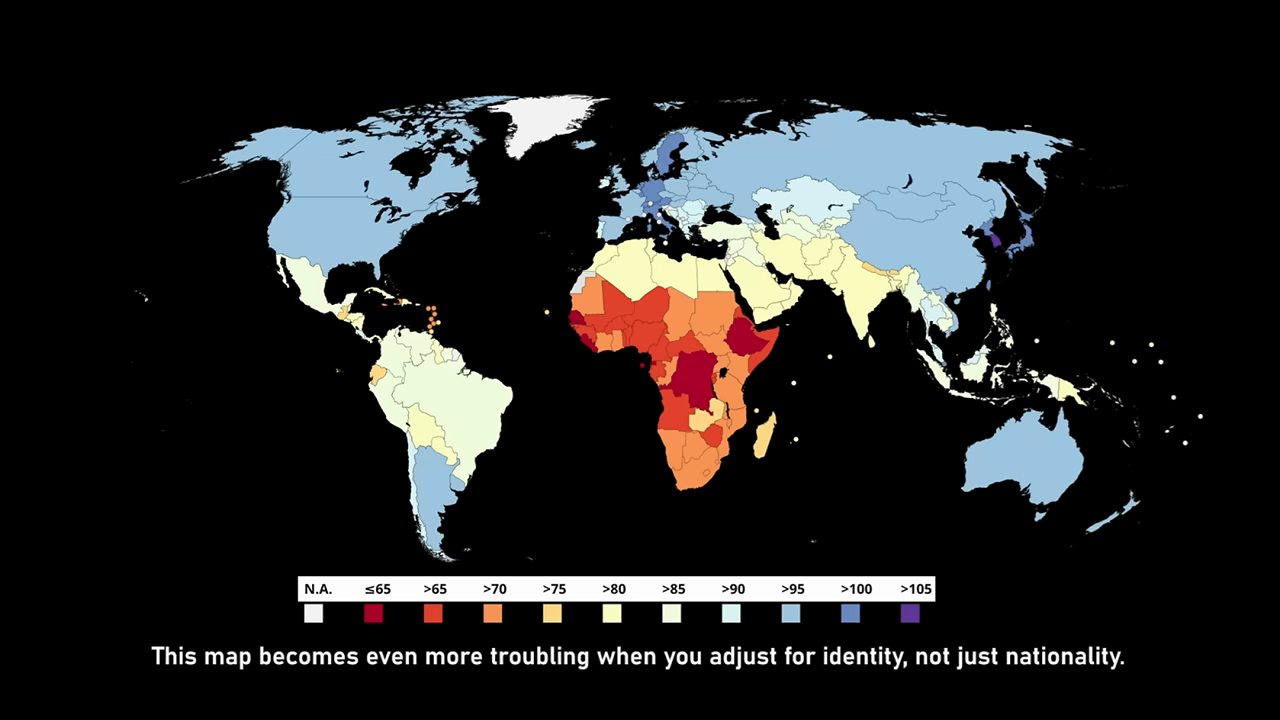
The frame is the exact visual family titled “World IQ map – Lynn 2002”, derived from Richard Lynn and Tatu Vanhanen’s IQ and the Wealth of Nations. The legend and country shading match the Wikimedia copy.

The map creates several layers of false precision:
heterogeneous tests and samples
     + uneven study years and ages
     + country estimates or imputations
                    ↓
             one national number
                    ↓
       one clean geographic color
                    ↓
      narrated as a population essence
A demographic review details recurring sampling, comparability, and imputation problems in national-IQ datasets. The European Human Behaviour and Evolution Association records that it issued a 2020 statement on the poor quality of these datasets. Sear 2022; EHBEA history
The subtitle is an additional error. It says the result becomes stronger after adjusting for “identity,” yet the video shows no identity-adjusted data. If identity means race, ethnicity, ancestry, or self-identification, those are different variables and require different samples and models.
2. The suppression slide
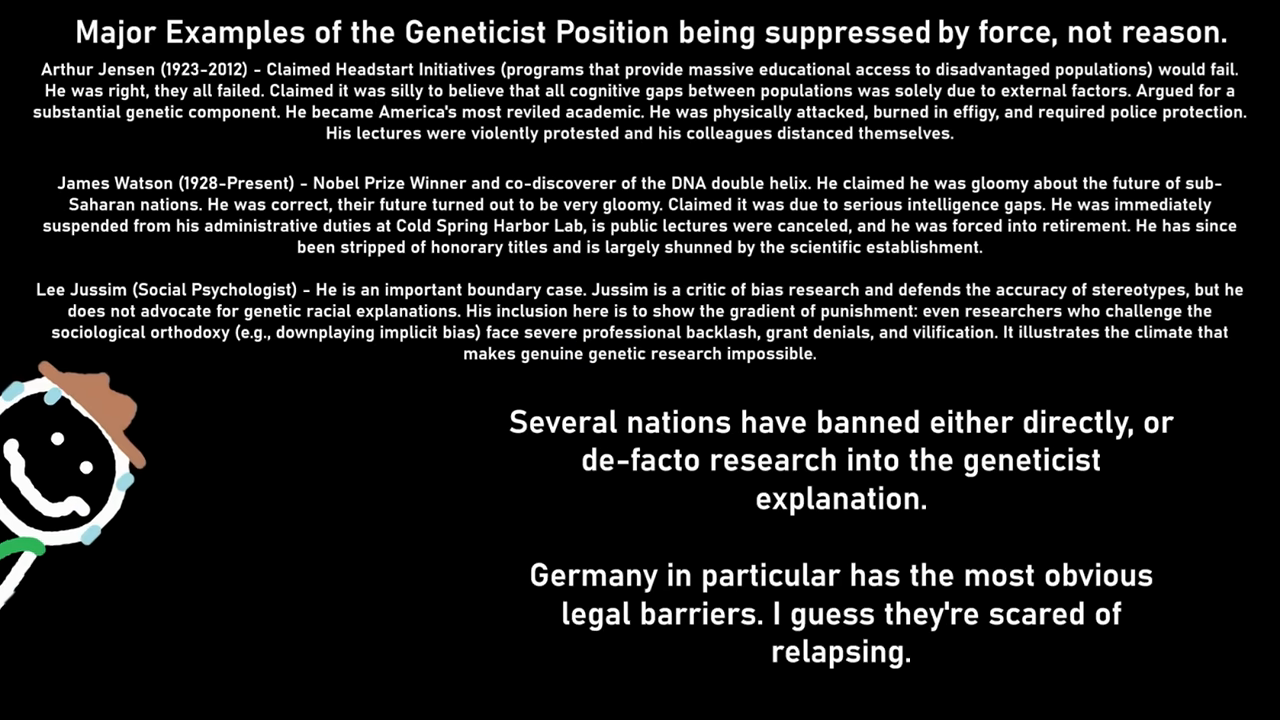
The slide is a creator-written synthesis rather than a reproduced academic table. Exact-phrase searches did not find a pre-video page containing the same Jensen–Watson–Jussim sequence or wording.
| Person | What is substantially true | What the slide gets wrong or cannot establish |
|---|---|---|
| Arthur Jensen | His 1969 article argued that compensatory education had not produced durable IQ gains and that genetic factors deserved study. He faced severe hostility, threats, disrupted lectures, police protection, and an attempted physical confrontation. | Head Start began in 1965, so the 1969 article was not a clean advance prediction of the program’s failure. Jensen said scholastic performance was more environmentally alterable than intelligence and urged programs be assessed on actual school outcomes, not IQ alone. In a later profile he explicitly said he had never been physically attacked. |
| James Watson | He made public claims about racial intelligence; Cold Spring Harbor suspended administrative duties in 2007 and revoked honorary titles in 2019. | CSHL described the claims as unsubstantiated and unsupported by science. A sanction is not evidence that the claim is correct. “Africa’s future turned out gloomy” is an undefined editorial judgment, not validation of a racial-genetic mechanism. The slide also incorrectly listed Watson as alive after his November 2025 death. |
| Lee Jussim | He has written about stereotype accuracy, political bias, and hostile academic climates; criticism and grant rejection can be studied empirically. | The slide admits he does not advocate genetic racial explanations. Rutgers lists him as a distinguished professor with an active laboratory. One grant anecdote cannot establish a blanket funding ban, much less that race-IQ genetics is impossible to study. |
The cases are heterogeneous: disruptive protest, institutional response to public speech, and disputed scholarship or grant review are not one outcome variable. The slide supplies no denominator: it does not compare similarly controversial scholars, proposal success rates, institutions, countries, time periods, or the quality of proposed research.
3. The Head Start slide
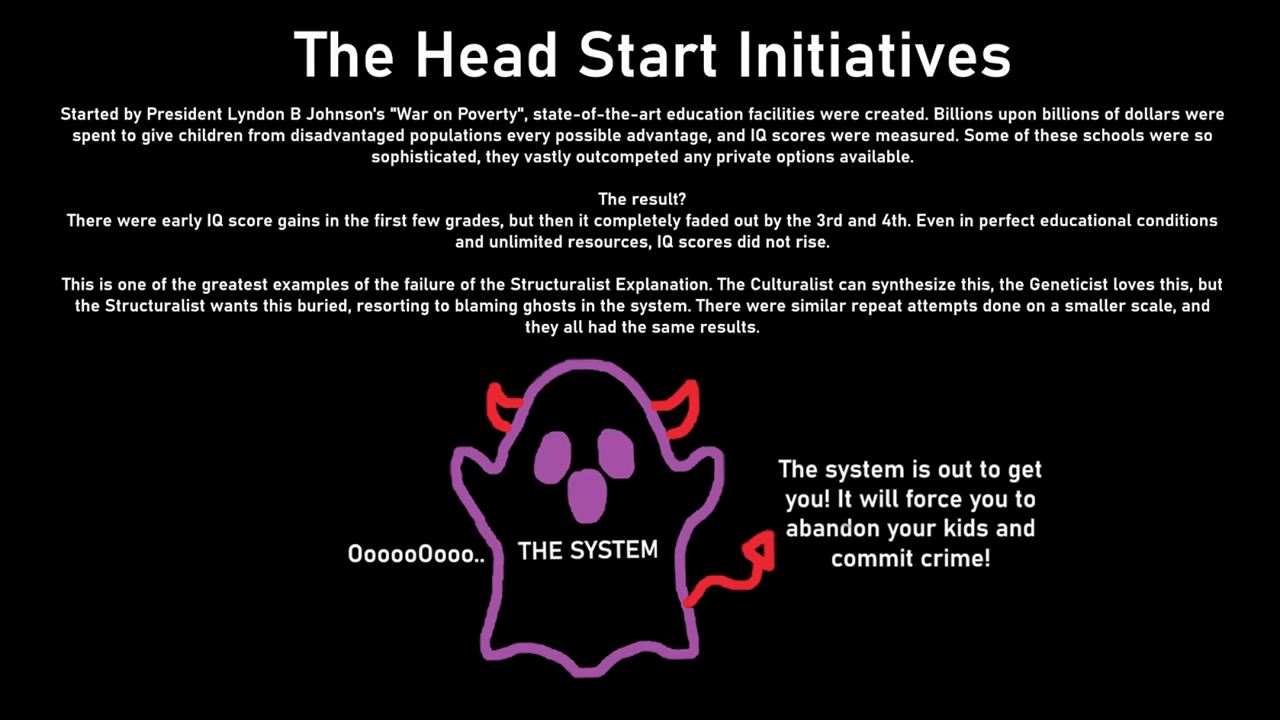
The narrow factual core is real: the randomized Head Start Impact Study detected favorable effects during the program years, but by the end of third grade found few statistically significant impacts across its measured cognitive, social-emotional, health, and parenting domains. HHS/ACF final report
The slide nevertheless misdescribes both the intervention and the inference:
- Head Start was a heterogeneous national program combining education, health, nutrition, family, and social services—not “perfect educational conditions.”
- The control group was not untreated. Roughly 60% of control children participated in another preschool, and children assigned to the control group at age three could enter Head Start at age four.
- “Billions” describes aggregate program spending, not unlimited resources per child or uniform implementation quality.
- The study estimated the effect of access to Head Start relative to the alternatives families actually used. It did not equalize every environmental cause or compare environmental causation with genetic causation.
- A faded test-score difference can coexist with benefits in schooling, health, earnings, or behavior.
Longer-term research accordingly does not support “they all failed.” Deming found a roughly 0.23-standard-deviation improvement in a young-adult outcome index despite test-score fadeout. Garces, Thomas, and Currie reported educational and criminal-justice benefits in sibling comparisons, with subgroup variation. Bailey, Sun, and Timpe found long-run improvements in education, economic self-sufficiency, and adult health from early Head Start exposure. Deming 2009; Garces, Thomas, and Currie 2002; Bailey, Sun, and Timpe 2021
The correct conclusion is limited:
Head Start access did not produce durable differences
on many measured third-grade outcomes in one major randomized study.

This does not imply:
the initial disparities were genetic,
environmental intervention generally cannot work,
or the program had no long-term benefits.
Study and concept audits
Individual heritability is not the cause of a group mean
Modern behavioral-genetic research provides strong evidence that genetic differences contribute to variation in cognitive performance among individuals in studied populations. Plomin and von Stumm 2018
But heritability is conditional on a population and its environments. It does not partition a difference between two group averages. Formally and conceptually, high within-group heritability can coexist with an environmentally caused between-group difference. Feldman and Ramachandran 2024
The video never provides the evidence necessary for its implicit between-group claim:
- representative and comparable cognitive phenotypes;
- measurement-equivalence testing across groups;
- causal variants or genomic predictors validated within each relevant ancestry;
- controls for population stratification, assortative mating, and indirect parental genetic effects;
- family-based, ancestry, or natural-experiment designs that distinguish inheritance from correlated environments;
- direct estimates of the genetic share of the between-group mean difference.
Polygenic scores are predictions, not self-interpreting causes. Their accuracy commonly falls when transported across ancestry groups, and associations can include population stratification, assortative mating, and indirect genetic effects. Ding et al. 2023; Pingault et al. 2022
Race, nationality, ancestry, and identity are not interchangeable
| Variable | What it measures | Why the distinction matters here |
|---|---|---|
| Nationality / country | Political territory or citizenship; the map uses country-level values | Countries contain multiple ancestries and unequal institutions, regions, and samples. |
| Race | Historically contingent social classification | Categories vary across societies and time and can affect treatment and self-identification. |
| Ethnicity | Shared identity, history, language, or culture | It is not a fixed genomic partition. |
| Genetic ancestry | Statistical patterns of descent relative to sampled reference populations | It is continuous, reference-dependent, and not automatically a causal variable. |
| Identity | Self- or socially assigned membership | The video never defines how it was measured or “adjusted.” |
The National Academies recommends not using race as a proxy for human genetic variation and not assuming that named population groups are homogeneous or fixed. National Academies 2023
“Persistence” does not identify a cause
The Black–white test-score gap in the United States is neither perfectly invariant nor automatically explained by its persistence. Dickens and Flynn analyzed nine standardization samples and estimated that Black Americans gained roughly 4–7 IQ points relative to non-Hispanic whites between 1972 and 2002. Dickens and Flynn 2006
That convergence does not prove a wholly environmental explanation. It does refute the video’s suggestion of a stable, timeless quantity. More generally:
persistence can be generated by persistent institutions,
persistent environments, gene–environment correlation,
genetic differences, measurement artifacts, or mixtures.

change can be generated by environmental change,
test change, selection change, demographic change, or mixtures.
The observed trend must be paired with a design capable of separating those mechanisms.
The structural–cultural–genetic trichotomy
The video’s three buckets are useful labels for political rhetoric but poor causal variables.
| Interaction the trichotomy hides | Example |
|---|---|
| Structure → culture | School, housing, labor, policing, and family policy alter incentives and transmitted norms. |
| Culture → structure | Organized beliefs and norms reshape laws and institutions. |
| Environment → measured genetic association | Population stratification and social sorting can correlate ancestry-linked variants with environments. |
| Parental genes → child environment | Genetically influenced parental traits can shape the developmental setting, creating indirect genetic effects. |
| Environment × genotype | The expression and measured heritability of a trait can vary across social conditions and countries. |
Cross-national meta-analysis, for example, found that socioeconomic moderation of intelligence heritability differs across societies rather than following one universal rule. Tucker-Drob and Bates 2016
Suppression, law, and research freedom
The strongest fair version of the video’s concern is that public controversy can discourage some questions, distort incentives, and expose researchers to protest or sanction. Threats and violence are wrong regardless of whether a hypothesis is correct.
The stronger claims are not demonstrated:
- “Illegal in many nations”: no country list or statute is supplied. Germany is the only nation named on the slide. Article 5(3) of Germany’s Basic Law says that arts, sciences, research, and teaching are free. General criminal, privacy, equality, and research-ethics rules still apply. German Basic Law
- “Grants are impossible”: requires proposal-level data, comparable topics and investigator quality, and the actual reasons for decisions. No such evidence appears.
- “Genuine research is impossible”: contradicted by active publication on intelligence genetics, ancestry, polygenic scores, measurement, and the controversy itself. This does not mean every proposed study is fundable, ethical, or free from stigma.
The legal conclusion should therefore remain calibrated: the video did not substantiate a categorical multi-country ban. A full jurisdiction-by-jurisdiction legal survey could uncover narrower restrictions, but that would still not prove a genetic cause for group means.
Methodological errors
- False trichotomy: overlapping causal levels are presented as rival, separable ideologies.
- Heritability transposition: evidence about individual variation is treated as evidence about group averages.
- Map reification: heterogeneous country estimates become a clean biological landscape.
- Nationality–identity equivocation: a national map is narrated as if adjusted for race or identity.
- Intervention-failure fallacy: incomplete remediation is treated as evidence that the original cause is genetic.
- Outcome switching: third-grade test fadeout becomes “Head Start failed,” despite multiple program goals and possible long-term non-test benefits.
- Straw-manning: structural accounts are defined as total, agency-denying, invisible, and unfalsifiable without citing an actual account.
- Asymmetric burden of proof: environmental claims are rejected for incomplete explanation while geneticism is elevated without a group-gap genetic estimate.
- Suppression-as-evidence: social hostility is made to increase the apparent truth of the disputed claim.
- Case aggregation: Jensen, Watson, and Jussim are treated as equivalent examples despite different claims, conduct, institutions, and outcomes.
- No denominator: dramatic cases are offered without comparison rates for other fields, hypotheses, grants, or controversial speech.
- Vague group comparison: unnamed “groups” that outperform or underperform replace a measurable analysis.
- Falsifiability inversion: institutional and environmental variables are called unmeasurable while the video’s genetic explanation is never operationalized or tested.
Source provenance
Verified visual lineage
- The opening image is the Lynn–Vanhanen 2002 national-IQ map preserved on Wikimedia Commons.
- The same map family appears in Racial Egalitarianism - All Arguments Ranked and Debunked, making this a verified cross-video image reuse, not merely a thematic similarity.
Intellectual lineage
The Head Start discussion is recognizably downstream of the Jensen-era compensatory-education debate. Jensen’s 1969 paper is a direct primary node, but the Basic Logic slide exaggerates it by saying Jensen predicted Head Start’s failure and that all initiatives failed.
The three-person suppression slide appears to be an unattributed creator compilation. Exact-phrase searches did not locate the complete combination on Human Varieties, OpenPsych, Emil Kirkegaard’s sites, Jonathan Barazzutti’s Substack, Gottskálk/Opin Augu, or another pre-video page. Absence of a match is not proof of original authorship.
Lynn and Vanhanen (2002)
        ↓
Wikimedia / copied national-IQ maps
        ↓
Basic Logic IQ video and Racial Egalitarianism video

Jensen (1969) and later hereditarian summaries
        ↓
Head Start as a referendum on environmentalism
        ↓
Basic Logic's “all failed” slide

academic-freedom / cancellation discourse
        ↓
Jensen + Watson + Jussim compilation
        ↓
Basic Logic suppression thesis
The broader sites already tracked in the hub remain possible ecosystem references, not verified direct sources for this video: Human Varieties, OpenPsych/Dalliard, Fuerst, Emil Kirkegaard, Jonathan Barazzutti, Gottskálk/Opin Augu, and The Boomer Tribune.
Cross-video comparison
| Recurring move | Genetics Behind Unequal Societies | Racial Egalitarianism | IQ Debate |
|---|---|---|---|
| Start with recognizable evidence | (F_{ST}), functional annotation, PCA, ancestry–SES table | Heritability, MTRAS, adaptive alleles, national-IQ map | National-IQ map, Head Start fadeout, public controversy |
| Convert evidence into a stronger premise | Population structure → racial neurology | Individual heritability → racial mean difference | Program fadeout → limits of environmental explanation |
| Treat an aggregate image as biology | PCA becomes kinship/social niche | Country colors become racial potential | Same country map introduced as “population” difference and identity-adjusted evidence |
| Minimize environmental complexity | SES regression treated as ancestry effect | Similar adoptive homes treated as environmental control | Head Start treated as perfect and unlimited environmental control |
| Move to civilizational politics | Neurologies allegedly produce institutions | Genes allegedly produce culture and immigration capacity | Geneticism portrayed as suppressed explanation elite institutions fear |
| Characteristic error | Annotation-to-trait inference | Within-to-between heritability error | Intervention-failure and suppression-as-evidence errors |
The third completed dossier strengthens two provisional channel-level hypotheses:
- Visual inheritance: the channel reuses already-circulating maps and figures without presenting their construction or limitations.
- Asymmetric skepticism: a limited or confounded environmental finding is treated as decisive, while the genetic alternative is not required to supply a direct causal estimate.
What evidence would change this verdict?
- a documented country-by-country legal survey showing which research questions or methods are prohibited and by which enforceable law;
- grant-level data comparing similarly situated proposals, topics, investigator records, and stated decision reasons;
- representative group samples with measurement equivalence and transparent environmental measurement;
- family-based or causal genomic designs that estimate the genetic contribution to the relevant between-group means;
- polygenic predictors validated within every population studied and robust to stratification, indirect effects, and assortative mating;
- Head Start evidence that defines failure in advance and weighs cognitive, educational, health, economic, and behavioral outcomes over the life course;
- a specified structural, cultural, genetic, or integrated model with predictions that could fail.
Open questions
- Which exact copy of the Wikimedia/Lynn–Vanhanen map did the editor download, and is it the same file used in the racial-egalitarianism video?
- Is the wording of the suppression slide original to Basic Logic, or does an archived social post contain the same Jensen–Watson–Jussim sequence?
- What countries did the creator mean by “illegal to research,” and what precise conduct or publication was allegedly prohibited?
- What evidence underlies “grants are impossible”: formal exclusions, inferred reviewer bias, or anecdotal rejection?
- Which groups were meant by the claim that some face greater obstacles yet outperform?
- Will later channel videos use Head Start or Jensen again, and will they preserve the same “all failed” wording?
Final assessment
The video is strongest as a warning against intimidation and intellectual taboo. It is weakest as science. It never measures a genetic contribution to a racial or national IQ gap, yet it gives geneticism rhetorical credit for the incompleteness of environmental explanations. Its evidence does not adjudicate the causal question it says society refuses to ask.
Cross-video connections
- Basic Logic Youtube Channel Research
- Basic Logic Cross-Video Claim Map
- The Genetics Behind Unequal Societies
- Racial Egalitarianism - All Arguments Ranked and Debunked
Source register
National-IQ data and measurement
- Wikimedia Commons. “World IQ map – Lynn 2002.”
- Sear, Rebecca. 2022. “Demography and the Rise, Apparent Fall, and Resurgence of Eugenics.” Population Studies 76:S201–S220.
- European Human Behaviour and Evolution Association. “EHBEA’s History.” Records the society’s 2020 statement on national-IQ datasets.
- Dickens, William T., and James R. Flynn. 2006. “Black Americans Reduce the Racial IQ Gap: Evidence from Standardization Samples.” Psychological Science 17:913–920.
Genetics, ancestry, and intelligence
- Plomin, Robert, and Sophie von Stumm. 2018. “The New Genetics of Intelligence.” Nature Reviews Genetics 19:148–159.
- Feldman, Marcus W., and Sohini Ramachandran. 2024. “Heritability Within Groups Is Uninformative About Differences Among Groups.” PNAS.
- National Academies of Sciences, Engineering, and Medicine. 2023. Using Population Descriptors in Genetics and Genomics Research.
- Ding, Yi, et al. 2023. “Polygenic Scoring Accuracy Varies Across the Genetic Ancestry Continuum.” Nature 618:774–781.
- Pingault, Jean-Baptiste, et al. 2022. “Using Genetic Data to Strengthen Causal Inference in Observational Research.” Molecular Psychiatry.
- Tucker-Drob, Elliot M., and Timothy C. Bates. 2016. “Large Cross-National Differences in Gene × Socioeconomic Status Interaction on Intelligence.” Psychological Science 27:138–149.
Head Start
- US Department of Health and Human Services, Administration for Children and Families. 2010. Head Start Impact Study: Final Report.
- US Department of Health and Human Services, Administration for Children and Families. 2012. Third Grade Follow-up to the Head Start Impact Study: Executive Summary.
- Deming, David. 2009. “Early Childhood Intervention and Life-Cycle Skill Development: Evidence from Head Start.” American Economic Journal: Applied Economics 1:111–134.
- Garces, Eliana, Duncan Thomas, and Janet Currie. 2002. “Longer-Term Effects of Head Start.” American Economic Review 92:999–1012.
- Bailey, Martha J., Shuqiao Sun, and Brenden Timpe. 2021. “Prep School for Poor Kids: The Long-Run Impacts of Head Start on Human Capital and Economic Self-Sufficiency.” NBER Working Paper 28268.
Suppression-slide cases and law
- Jensen, Arthur R. 1969. “How Much Can We Boost IQ and Scholastic Achievement?” Harvard Educational Review 39:1–123. Included as the primary text behind the Head Start/Jensen lineage, not as neutral authority for every later race-IQ claim.
- Nyborg, Helmuth. 2003. “Profiles in Research: Arthur Jensen.” Used for Jensen’s own account that he was threatened and protesters tried to reach him, but he was not physically attacked.
- Cold Spring Harbor Laboratory. 2019. “Statement Addressing Remarks by Dr. James D. Watson.”
- Cold Spring Harbor Laboratory. 2025. “In Remembrance of Dr. James D. Watson.”
- Rutgers University. Lee Jussim faculty profile.
- Federal Ministry of Justice, Germany. Basic Law for the Federal Republic of Germany, Article 5.
Full transcript
Full transcript (YouTube automatic captions; lightly normalized)
Automatic captions can mishear names, numbers, and punctuation. The wording below is retained as evidence of what the video appears to say, not as authentication of every proper noun or statistic.
0:02 — You might have seen this graph before which shows troubling differences between populations. So the question becomes why the disparity? There are three broad explanations: structure, culture, or genetics. But we’re only permitted to openly discuss two of them. One has become the enforced dogma of elite institutions. One is tolerated as folk wisdom, and one is so restricted it can’t even be openly studied. This isn’t a search for truth. It’s a managed conflict designed to be fought in a voting booth instead of resolved in a lab. Structuralism championed by academia and corporate policy claims disparities are solely the product of systemic racism and oppression. Poverty, biased institutions, and historical trauma cause lower IQ and bad outcomes. The solution is to dismantle and rebuild society. It removes agency from individuals and groups, placing all responsibility on an amorphous, often invisible system. Supporters point to
1:02 — well-documented histories of discrimination and the compounding effect that those can have across generations. Politically, this theory aligns closely with modern neo-Marxism, which reinterprets society through identity-based power dynamics. Culturalism is popular with the public, but marginalized in elite circles. It claims disparities stem from group culture. Values, family norms, and attitudes toward education and work are seen as the primary drivers of outcomes. A bad culture produces lower IQ. The solution is assimilation and personal responsibility. Supporters highlight groups who succeeded despite discrimination, attributing it to strong cultural norms and work ethic. Politically, this theory synthesizes with color-blind meritocracies where individual agency is favored. Geneticism claims average innate biological differences in cognitive capacity and behavioral predispositions explain the gaps. Here, lower IQ is the cause of
2:03 — cultural and socioeconomic problems, not the result. It argues that average biological differences produce different outcomes and that environmental interventions have a limited effect. This position is not just criticized. It is illegal to research in many nations. Grants are impossible. Careers are destroyed for pursuing it. Supporters cite the persistence of IQ gaps across time, geography, and socioeconomic levels. Patterns they argue culture or structure alone cannot fully explain. Politically speaking, this theory favors fringe ideologies due to its suppressed status. Everyone can agree that structure, culture, and genetics all influence outcomes to some degree. The real debate is about which factor dominates. Academia wants to force the structuralist position down our throats. But let’s be honest, it’s not enough. The structuralist framework removes all agency and ignores that some groups face greater visible obstacles yet outperform, while others enjoy visible
3:05 — advantages yet underperform. These contradictions weaken a structural explanation. The argument relies on the existence of invisible, unfalsifiable forces in a system that can never be precisely measured or reformed. This, combined with the insufficiency of the structuralist and culturalist positions, has resulted in a radicalizing community of people that see the geneticist position as a suppressed truth. Without being allowed to actually study it and get into how structure, culture, and genetics impact a population’s IQ, we’re stuck in endless infighting. What do we fear more? Uncomfortable answers or a permanent political cold war built on ignorance?