Project navigation
Executive verdict
Mostly misleading. Groundwater potential, failed infrastructure, maintenance incentives, and governance are legitimate concerns. The evidence does not establish an inherited continental inability to plan or a general rule that humanitarian assistance makes water shortages permanent.
The strongest correction comes from the field research: initial breakdown and prolonged downtime have different determinants. Aquifer conditions, construction, and equipment help explain failures; finance, repair capacity, spare parts, leadership, and community arrangements help explain restoration. Treating these as one psychological defect obscures the mechanisms that can actually be tested.12
Useful response: A broken pump can establish a maintenance problem. Establishing a genetic cause requires a separate genetic study. The relevant research measures engineering and management failures, while the official coverage series records substantial progress.
Research status and source record
- Source: Basic Logic — Why Does Africa Actually Lack Water?
- Publication: October 22, 2026; length: 8:31; metadata identifies the verified Basic Logic channel
UCA6oXQTT_mtCj32dZDdoL6w. - Reviewed: November 8, 2026, America/New_York.
- Capture: Original English audio recovered and automatically transcribed with Whisper small. Official YouTube captions returned HTTP 429. Claim labels are paraphrases; timestamps are approximate. The short excerpt below is from the automatic transcription.
- Visuals: Full-video contact sheets and targeted frames reviewed; four relevant frames preserved below. The review includes the Dutch welfare graphics and the national-IQ map, which appear briefly.
- Scope: Twenty substantive claim dispositions. Sponsor merchandise/history assertions at approximately 3:54–4:38 are outside this water/development review. Anonymous anecdotes remain unverified.
- Completion meaning: The main argument has been adjudicated with disclosed limits; unresolved provenance is not treated as proof that an anecdote was invented.
Timestamped claim-by-claim fact-check
| Time | Claim, paraphrased | Assessment | Evidence and reasoning |
|---|---|---|---|
| 0:00–0:30 | Water deprivation persists despite assistance | Real problem; misleading trajectory | Persistent deprivation can coexist with improvement. At least basic drinking-water coverage in sub-Saharan Africa rose from 59.2% in 2015 to 67.5% in 2024. Persistence alone cannot establish that assistance caused the problem.3 |
| 0:13–0:24 | $2.6T aid; $5T inflation-adjusted | Not reproducible as specified | No period, flow definition, recipient set, or price base is supplied. A defined World Bank net-ODA comparison produces different totals; see the calculation below. The narration does acknowledge that aid covers other sectors, so this is not a claim that all the money funded wells.4 |
| 0:35–0:44 | Extensive African groundwater reserves | Substantially correct | WaterAid/BGS identifies major groundwater potential. Its own explanation emphasizes investment, expertise, sustainable extraction, maintenance, and management.5 |
| 0:44–0:51; 2:04 | Simple ancient wells generally suffice | Overgeneralized | A continental resource map does not specify a village’s accessible yield or safe supply. Fieldwork identifies aquifer limitations, pump configuration, component damage, and repair requirements.1 |
| 1:03–1:27 | Colonialism’s net effect was beneficial | Unsupported counterfactual | Observed population or output growth under colonial rule cannot reveal what would have happened otherwise. Research identifies persistent benefits from particular investments alongside arguments and evidence concerning harmful institutional legacies.67 |
| 1:30–1:56 | Corrupt rulers reflect deserving populations | Unestablished causal claim | A proverb supplies no measurement of selection, coercion, accountability, or control over rulers. Corruption can matter without proving a uniform population trait. No quantified aid-theft estimate is established here. |
| 2:15–2:40 | Communities demand drilling bribes | Anecdotes unverified | The narration does not identify the projects, reports, countries, sample, or frequency denominator. A documented local dispute could establish an event; it would not measure continental prevalence. |
| 2:44–2:49 | Trash avoidance is sufficient maintenance | False as a general engineering account | Pumps also require functioning components, suitable construction, repair expertise, and a sustainable operating arrangement. The animation shows an open well; much of the cited research concerns engineered boreholes with handpumps.12 |
| 2:51–3:00 | 40% fail within several years | Exact statistic unverified | Estimates depend on country, technology, age, and definition. A major review estimates roughly 25% of SSA handpumps nonfunctional at a given moment. That is a different quantity from cumulative failure within an early-life interval; it neither validates nor directly disproves the uncited 40% claim.8 |
| 3:00–3:38 | Refusal and trash principally explain failure | Unsupported attribution | Physical examination and mixed-method research find several measurable determinants. Their results do not identify deliberate trash disposal or generalized unwillingness as the dominant continental cause.12 |
| 4:39–5:54 | Workers characteristically quit after payday | Unverified generalization | No employer records, colonial documents, sampling frame, or comparison group are identified. Even a verified episode would require investigation of wages, contracts, alternative work, and household constraints before inferring a stable psychological trait. |
| 5:54–6:15 | Proverb/time concepts demonstrate limited foresight | Unsupported measurement | A joke or an unspecified cultural description is not a validated planning task. No named population, anthropological source, or operational measure is supplied for the time-concept assertion. |
| 6:21–6:40 | Diaspora outcomes establish inherited impatience | Outcome substitution | The displayed Dutch charts do contain verifiable welfare disparities. They measure benefit receipt by origin, birthplace, and sometimes residence duration; they contain no patience or genetic variable. See the table-level audit below.9 |
| 6:40–6:50 | African impatience is effectively universal | Not supported | The Global Preference Survey finds meaningful between-country differences and still greater within-country heterogeneity. Its preference measures do not identify a racial genetic cause.10 |
| 6:54–6:57 | Genetics best predicts IQ | Undefined ranking; causal leap | Heritability, measured-DNA prediction, and prediction of individual test scores are different questions. No predictor comparison or relevant genetic design is provided. Evidence of heritability within a population does not identify the causes of a difference between group averages.11 |
| 6:57–7:00 | IQ best predicts patience | Unestablished ranking | A 24-study meta-analysis reports an intelligence–delay-discounting association of about r = −0.23. That correlation establishes neither the strongest predictor nor a genetic cause.12 |
| Approximately 7:00 | National-IQ map supports mechanism | Measurement and causal mismatch | The figure belongs to the map family audited in Why Is Africa Like That > 8. The reused national-IQ map. National cognitive estimates do not measure inherited maintenance behavior or identify an IQ → patience → infrastructure causal chain. |
| 7:03–7:20 | Resources/education cannot substantially change outcomes | Unsupported extrapolation | Individual variation and genetic influence do not logically imply immutability. Measured infrastructure and transfer interventions show outcomes can change; none requires assuming everyone starts with identical traits.1314 |
| 7:20–8:03 | Aid generally creates disabling dependency | Design risk elevated into a general rule | Incentives and ineffective support arrangements warrant scrutiny. However, randomized Kenyan evidence finds gains in assets and consumption, and a water intervention improves source quality. Neither proves all assistance succeeds; both matter against an undifferentiated failure claim.14132 |
| 8:03–8:25 | Withdrawal self-corrects; assistance perpetuates deprivation | Unsupported counterfactual and prediction | Survival, migration, institutional adaptation, and successful service provision are different outcomes. Predicting improvement after withdrawal requires evidence on the specified policy and population. Continued shortages alone do not identify the effect of intervention.3 |
What the water research actually measures
Groundwater potential is not delivered safe water
The WaterAid/BGS item displayed around 0:45 is the March 22, 2022 announcement. Its groundwater premise is real. The same source stresses underfunded services, technical capacity, water quality, and sustainable management. Selecting the resource finding while dismissing those constraints misrepresents the source’s explanation.5
Four separate quantities matter:
- Storage: water held underground.
- Recharge: replenishment over time.
- Extractable yield: what a particular site and installation can supply.
- Service: sufficient, accessible, reliable water of suitable quality.
A promising resource does not supply the engineering, organization, or finance needed to deliver a service. These distinctions also explain why a national map cannot settle a local drilling decision.
Broken equipment, downtime, and maintenance are different outcomes
MacAllister et al. (2022) physically examined 145 handpump boreholes in Ethiopia, Uganda, and Malawi. Nineteen percent were in aquifers below the study’s transmissivity threshold for sustaining a handpump; 53% of galvanized rising-main pipes were corroded. The study also identifies configuration and component problems. These are sampled technical findings, not estimates for every African well.1
MacAllister et al. (2026), published before this video, combines field measurements, regression, and local narratives. Physical/technical factors dominate the modeled probability of a failure in the previous year; social factors, including spare parts and finance, dominate cumulative downtime. Motivation, leadership, skills, and external support can matter. Some formal finance/support arrangements perform poorly. This supports serious criticism of maintenance systems while requiring a more specific explanation than inherited unwillingness.2
These two papers draw on the same 145-borehole research programme. They are complementary analyses, not independent replications. Regression associations and nine detailed site narratives also cannot establish universal causes or exclude every behavioral contribution.
Murray et al. (2024) studies a different monitoring dataset: 1,805 randomly selected NGO-program water points across nine countries, seven in SSA and two in South Asia. Water was available at 79% of older points, aged 1–12 years, and 92% of points under one year. Functionality was associated with operational committees, financial savings, and maintenance arrangements. The sample is program-specific and the analysis observational; it is not a continent-wide experiment.15
The Foster et al. review, published online in 2019 and in its 2020 journal issue, covers 47 countries across SSA and Asia-Pacific and estimates approximately one in four SSA handpumps nonfunctional at a moment in time.8 Always separate:
- a snapshot of currently working equipment;
- a cohort failure rate over a specified interval;
- downtime and repair speed;
- safe, adequate service, which requires more than water emerging during a visit.
The video’s precise 40% early-failure figure remains untraced. The stronger finding is that a failure percentage, even if correct, does not identify refusal as its cause.
Official-data checks
Water access improved while serious deprivation remained
WHO/UNICEF JMP estimates distributed through the World Bank, region ZG = Sub-Saharan Africa, retrieved November 8, 2026:3
| Service measure | 2015 | 2024 | Change |
|---|---|---|---|
| At least basic drinking water | 59.2% | 67.5% | +8.3 percentage points |
| Safely managed drinking water | 26.4% | 32.4% | +6.0 percentage points |
“At least basic” includes improved sources with a round-trip collection time of no more than 30 minutes, including queuing. Safely managed additionally requires water on premises, available when needed, and free from specified contamination. The latter is a subset of the former; do not add the percentages. Estimates use different service criteria and have monitoring limitations.3
This documents progress. It does not estimate how much improvement was caused by foreign aid, domestic investment, income growth, or another factor. Population growth also means an improving share can coexist with a very large unmet need.
A defined aid calculation does not reproduce the headline
The World Bank API responses available at review contain 64 annual nonmissing observations, 1960–2023, for net ODA received by SSA:4
| Series | Sum, 1960–2023 | Interpretation |
|---|---|---|
DT.ODA.ODAT.CD | $1.333 trillion | Annual net ODA in current US dollars, summed |
DT.ODA.ODAT.KD | $1.848 trillion | The same concept expressed in constant 2023 US dollars, summed |
Calculation: add each available annual regional value once. These are alternative price presentations of the flow, not amounts to combine. No missing observation is assigned zero.
Verdict boundary: These totals fail to reproduce the video’s figures under this explicit definition. They do not establish that every conceivable aid aggregate is wrong. Gross versus net flows, all Africa versus SSA, additional years, inclusion of other flows, and the inflation base could change a comparison. Until the creator supplies those choices, the exact headline is unverified. An all-sector cumulative aid total also cannot stand in for a water-project budget or impact estimate.
- Annual source values and API links (file not included in this release)
- Saved API responses, CSV, video metadata, and calculation notes (file not included in this release)
Audit of the displayed Dutch welfare charts
The collage at approximately 6:40 contains three graphics. Two can be checked directly against Statistics Netherlands (CBS), Integratie en samenleven 2024:9
| Displayed comparison | Verified source | Source values |
|---|---|---|
| Social assistance by Moroccan origin/birthplace, September 2023 | Table 4.3.6; also 4.3.5a–b | Morocco-born 18.3%; Netherlands-born Moroccan origin 4.7%; national population 3.3% |
| Assistance among residents present at least nine years, September 2023 | Table 4.3.7b | Somalia-born 33.1%; Eritrea-born 26.9%; all foreign-born with the same duration restriction 10.2% |
The rates refer to persons 15 to state-pension age and to bijstand, social assistance. The residence-duration comparison corresponds to 4.3.7b; retaining the same duration restriction for the comparison group is necessary. Both verified charts accurately reproduce these selected values.
The smaller 2022 crop has its legend cut off. Its exact original chart has not been authenticated in this review; the 2024 tables must not be substituted for it.
The verified differences remain substantial. Their interpretation requires attention to migration route, cohort, age, education, and labor-market conditions. CBS explicitly discusses composition and refugee-country origins. Birthplace, national origin, race, and genetic ancestry are distinct classifications. Morocco is in North Africa, and benefit receipt does not measure a delay-discounting task, work refusal, fraud, or inherited cognitive capacity. These charts cannot identify the proposed cause of SSA pump failures.
IQ, patience, and genetic causation
Short automatic-transcription excerpt, approximately 6:54–7:00
“Genetics are the best predictor of IQ. IQ is the best predictor of low time preference.”
Three different questions have been compressed into that transition:
- Individual association: Do cognitive-test scores correlate with choosing later rewards?
- Group measurement: Do comparable samples differ on a defined measure of patience?
- Causal explanation: What produces that difference, and does it explain infrastructure outcomes?
Shamosh and Gray’s meta-analysis includes 24 studies and 26 effect sizes, with a weighted correlation of r ≈ −0.23 between intelligence and delay discounting. Its square is about 0.053, an illustrative bivariate association of roughly 5% in a simple linear setting, not a causal variance decomposition or a genetic estimate. A correlation alone supplies no ranking against all other predictors.12
The Global Preference Survey covers roughly 80,000 people in 76 countries. It finds substantial between-country variation alongside greater within-country heterogeneity, with some individual associations varying by country. This is evidence that preferences can be studied systematically; it is not evidence of one uniform African phenotype or its genetic cause.10
The National Academies’ genomics recommendations require appropriate population descriptors and direct attention to relevant environmental exposures. Race should not substitute for measured genetic variation.11 Likewise, within-population heritability does not identify the cause of a between-population average: that requires a design addressing ancestry, shared environments, measurement, and confounding.
The map around 7:00 visually matches the national-IQ map family in the earlier map audit. Exact file/crop lineage remains open. A map supplies neither the genetic design nor evidence linking individual preferences to a water system’s repair history. For methodological criticism of the national-IQ datasets, use Rebecca Sear’s correctly identified PsyArXiv preprint, not an unsupported journal attribution.16
Counterevidence and fair limits
Specific interventions can improve outcomes
Water infrastructure: Kremer, Leino, Miguel, and Zwane’s randomized Kenyan spring-protection study finds a 66% reduction in source fecal contamination and about a one-quarter reduction in child diarrhea. Household water improved less because of recontamination. This is a concrete benefit with a real implementation limitation, rather than evidence that every water project succeeds.13
Cash assistance: Egger, Haushofer, Miguel, Niehaus, and Walker’s Kenyan experiment transferred roughly $1,000 to over 10,500 poor households across 653 randomized villages. It finds increased consumption and assets, positive spillovers, and little price inflation. These setting-specific findings do not establish the result of every aid programme or permanent transformation, but they are relevant counterevidence to automatic destructive dependency.14
Neither experiment tests an entire continent or every aid channel. The proper comparison is a specified intervention against a credible counterfactual, with effects on service, welfare, incentives, and durability measured separately. Some designs can fail; evidence for failure in one design cannot establish incapacity in a population.
Colonialism needs a counterfactual
Huillery’s research finds persistent benefits from particular colonial public investments in French West Africa.6 Heldring and Robinson evaluate broader colonial legacies and argue that colonialism likely had negative overall developmental effects.7 These are different questions and forms of evidence. Beneficial school or infrastructure investments can coexist with harmful coercion or institutions. Neither observed growth nor a list of harms, by itself, identifies the complete alternative historical path. The video’s categorical net-benefit conclusion is not demonstrated.
Preserved visual evidence
0:42 — Groundwater-depth map
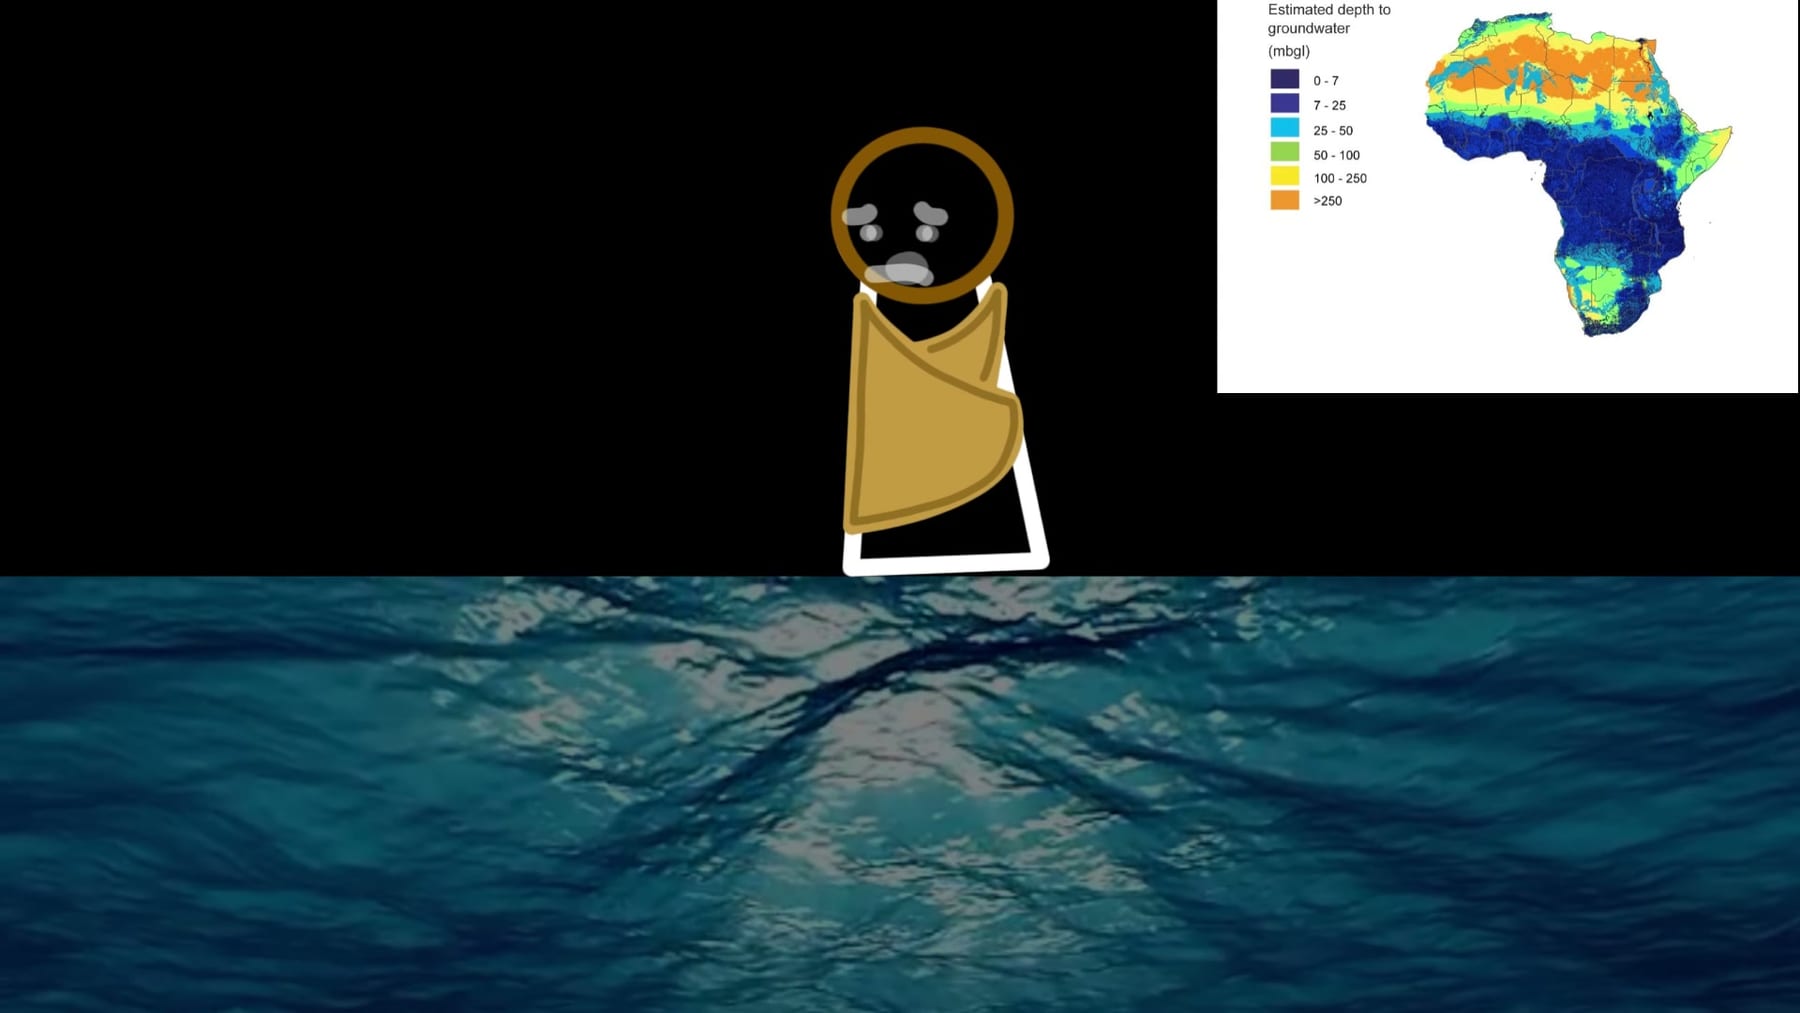
The legend records estimated depth to groundwater. This is a resource characteristic, not a measure of safely managed service. A WaterAid/BGS excerpt and productivity map appear moments later; the March 2022 source was located.5
2:48 — Open-well maintenance illustration
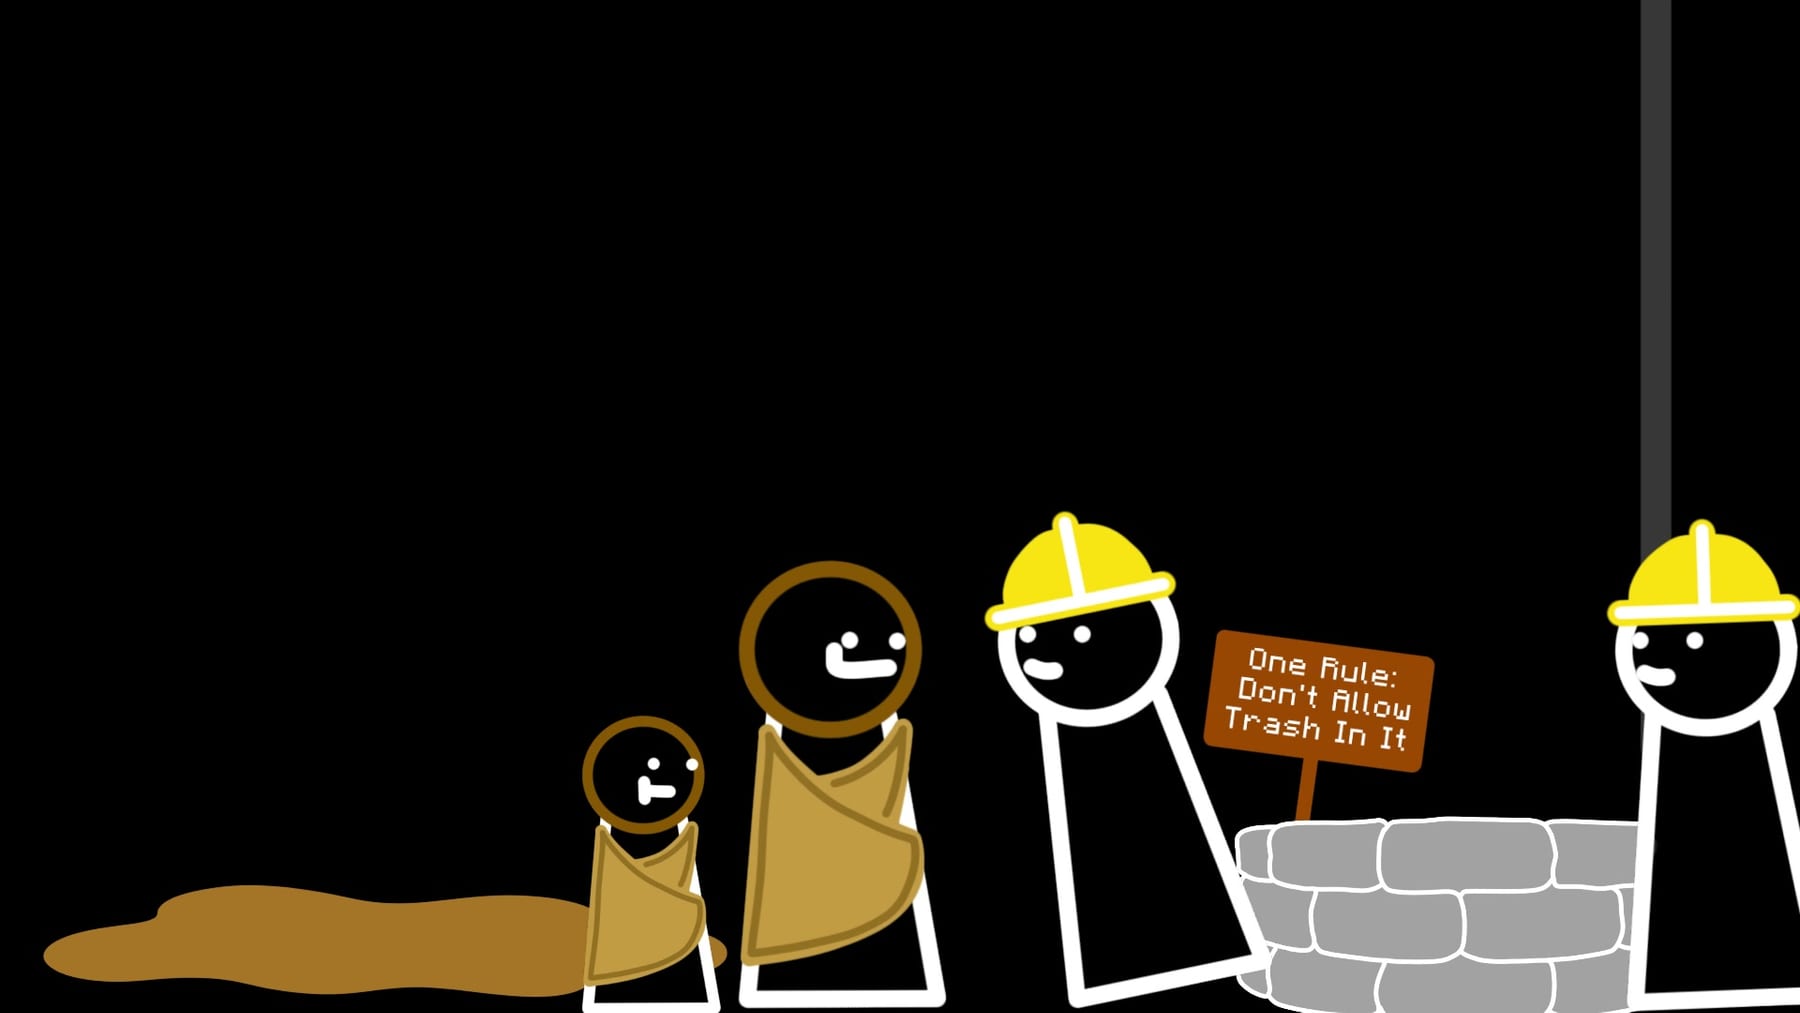
The cartoon is an illustration. Generalizing from it to engineered boreholes bypasses the construction and component issues examined in field studies.
6:40 — Benefit charts and hypothetical choice
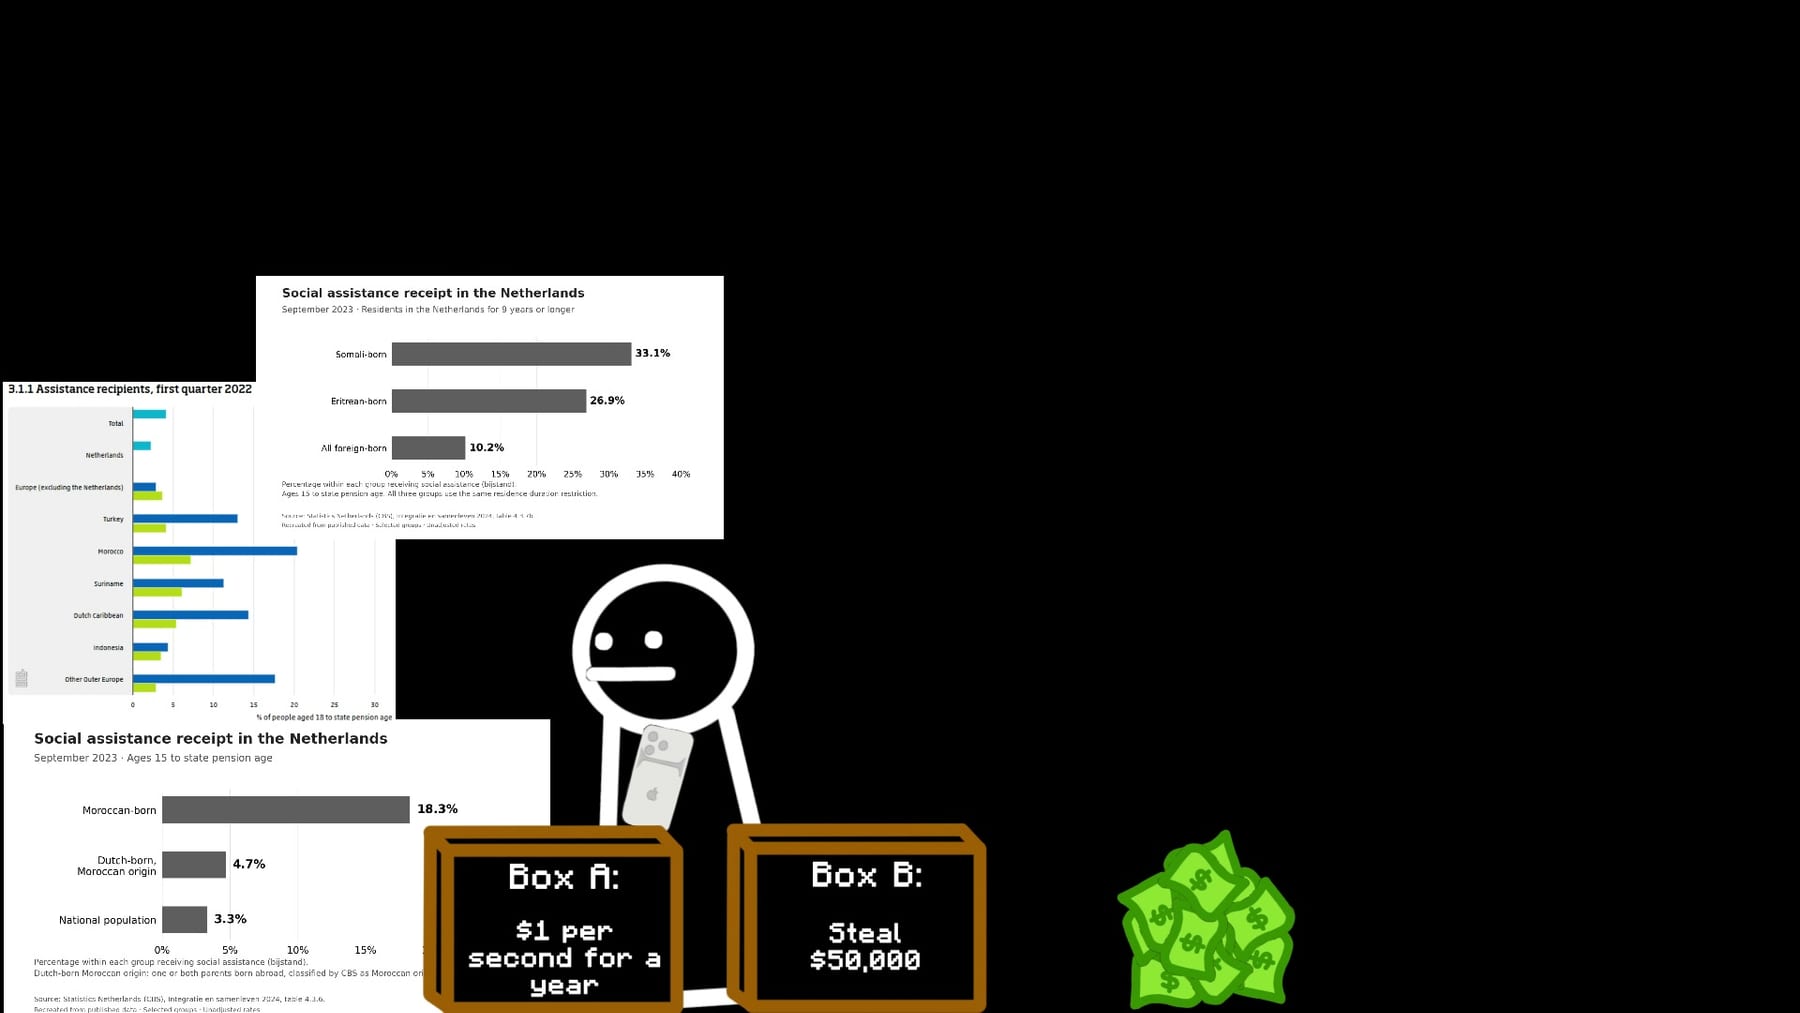
The chart values and their limitations are audited above. The adjacent money/crime choice is fictional animation, not an observed experiment.
7:00 — Genetics-to-IQ-to-patience diagram and national map
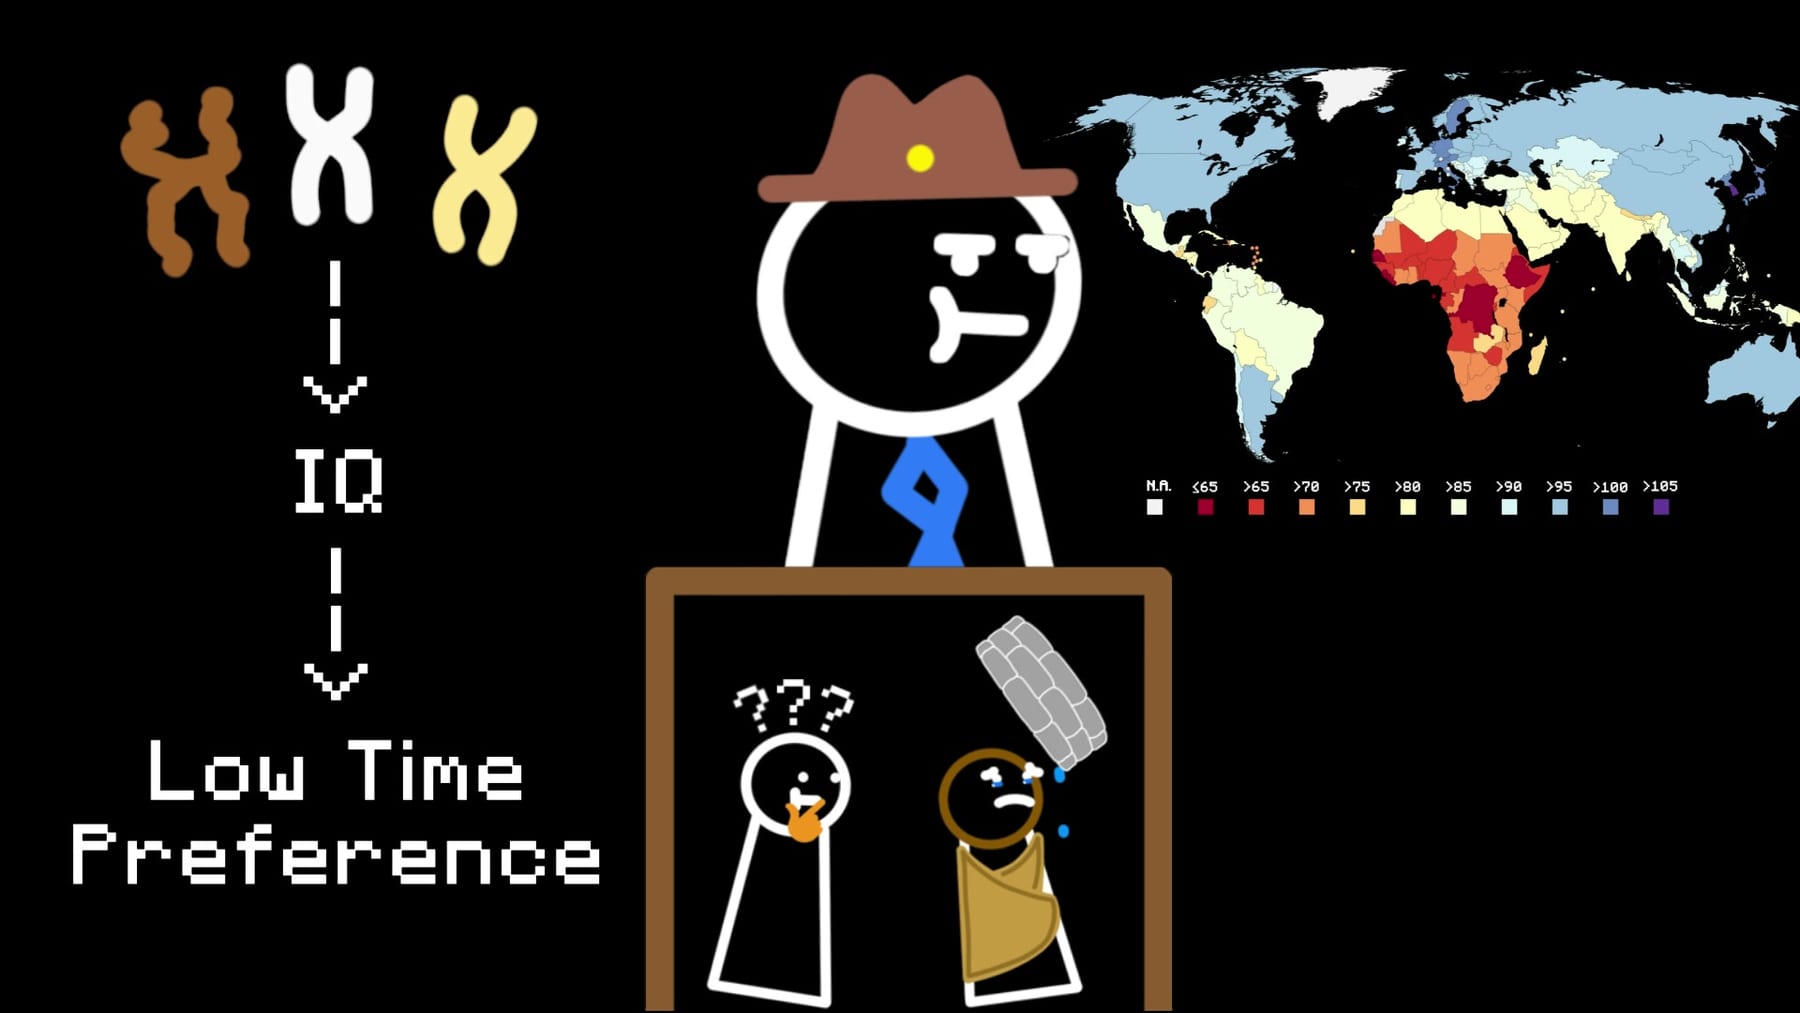
The diagram asserts a causal chain; it does not estimate it. Compare the retained map in Why Is Africa Like That > 8. The reused national-IQ map.
Cross-video connections and provenance
- Why Is Africa Like That — closest substantive comparison; development, colonialism, maintenance/dependency explanations, and national-IQ imagery.
- The IQ Debate We're Not Allowed To Have and The Genetics Behind Unequal Societies — compare the move from measured variation to an untested genetic explanation.
- Water infrastructure and inherited impatience — records the new comparison without treating source similarity as creator identification.
Verified source contact: the visible WaterAid/BGS wording matches the 2022 announcement; two recreated welfare charts match CBS values; the IQ-map family visually matches an existing retained frame. Unresolved: the immediate download/crop paths, the original 2022 welfare graphic, the source of the aid totals, the 40% cohort claim, and the work/bribery anecdotes. Shared ideas alone do not establish a particular intermediary or civil identity.
What evidence would change the verdict?
- A named, adequately sampled project cohort could validate the 40% statistic; measured failure causes would still need separate examination.
- Project records could validate individual drilling or wage anecdotes; comparative, representative evidence would be needed for broader prevalence claims.
- A disclosed aid series, years, recipient geography, and inflation method could reproduce the financial headline.
- Comparable preference data and a credible genetic/environmental design could test the proposed psychological mechanism. A national map or benefit register cannot perform that test.
- Long-term intervention comparisons could establish harmful dependency for specified programmes or identify successful maintenance arrangements. Preserve either result rather than extrapolating from an isolated example.
Source register
Footnotes
-
MacAllister et al. 2022, Contribution of physical factors to handpump borehole functionality in Africa, Science of the Total Environment 851, 158343. DOI. Primary field study, 145 boreholes. ↩ ↩2 ↩3 ↩4 ↩5
-
MacAllister et al. February 17, 2026, Connecting narratives and numbers to investigate the interaction of social, physical and technical determinants of rural water supply performance, PLOS Water 5(2), e0000486. Same research programme as the 2022 technical study; complementary evidence rather than independent replication. ↩ ↩2 ↩3 ↩4 ↩5
-
WHO/UNICEF Joint Monitoring Programme, distributed by World Bank: at least basic drinking water,
SH.H2O.BASW.ZSand safely managed drinking water,SH.H2O.SMDW.ZS. Basic-water API; safely-managed API. API last updated October 8, 2026; downloaded November 8. Definitions: UNICEF drinking-water monitoring. 2025 JMP household report covers estimates through 2024. ↩ ↩2 ↩3 ↩4 -
World Bank/OECD development-assistance series: net ODA received, current US dollars and constant US dollars. Current-dollar API; constant-dollar API. In the saved response, the constant series is explicitly 2023 US dollars. Period, observations, missingness, and sums are preserved with the local data files. ↩ ↩2
-
WaterAid and British Geological Survey, March 22, 2022, Most African countries have enough groundwater reserves to face at least five years of drought. Origin of the onscreen excerpt; the source also emphasizes investment, expertise, water quality, maintenance, and management. ↩ ↩2 ↩3
-
Elise Huillery 2009, History Matters: The Long-Term Impact of Colonial Public Investments in French West Africa, American Economic Journal: Applied Economics 1(2), 176–215. Studies spatial discontinuities and persistent investment effects, not the complete net effect of colonial rule. ↩ ↩2
-
Heldring and Robinson 2012, Colonialism and Economic Development in Africa, NBER Working Paper 18566. DOI. A historical/counterfactual assessment, not a randomized estimate of a single uniform colonial effect. ↩ ↩2
-
Foster, Furey, Banks, and Willetts, online 2019; issue 2020, Functionality of handpump water supplies: a review of data from sub-Saharan Africa and the Asia-Pacific region, International Journal of Water Resources Development 36(5), 855–869. DOI. Review of 47 countries across both regions; approximate SSA snapshot estimate, not a 40% early-life cohort result. ↩ ↩2
-
Statistics Netherlands, Integratie en samenleven 2024, Sociaaleconomische positie, tables 4.3.6 and 4.3.7b; 4.3.5a–b provide related time series. Official HTML/chart data checked against the screenshot. Figures describe September 2023, not 2024 outcomes. CBS’s English 2022 summary provides additional background; it is not authentication of the small 2022 crop. ↩ ↩2
-
Falk, Becker, Dohmen, Enke, Huffman, and Sunde 2018, Global Evidence on Economic Preferences, Quarterly Journal of Economics 133(4), 1645–1692. Research team’s dataset and methods page. Survey fieldwork was part of the 2012 Gallup World Poll. ↩ ↩2
-
National Academies of Sciences, Engineering, and Medicine 2023, Using Population Descriptors in Genetics and Genomics Research, with recommendations PDF. Methodological guidance on genetic variation, population labels, and relevant environmental measures. ↩ ↩2
-
Shamosh and Gray 2008, Delay discounting and intelligence: A meta-analysis, Intelligence 36(4), 289–305. Publisher abstract; ERIC bibliographic/abstract record. Twenty-four studies; 26 effect sizes; weighted r = −0.23. ↩ ↩2
-
Kremer, Leino, Miguel, and Zwane 2011, Spring Cleaning: Rural Water Impacts, Valuation, and Property Rights Institutions, Quarterly Journal of Economics 126(1), 145–205. DOI. Randomized Kenyan spring-protection evaluation; source and household outcomes differ. ↩ ↩2 ↩3
-
Egger, Haushofer, Miguel, Niehaus, and Walker 2022, General Equilibrium Effects of Cash Transfers: Experimental Evidence from Kenya, Econometrica 90(6), 2603–2643. DOI. Randomized intervention with local spillovers; generalization beyond the setting requires care. ↩ ↩2 ↩3
-
Murray et al. 2024, Rural Water Point Functionality Estimates and Associations: Evidence From Nine Countries in Sub-Saharan Africa and South Asia, Water Resources Research 60, e2023WR034679. Monitoring observations from 2017–2020; selected NGO programmes. ↩
-
Rebecca Sear 2022, ‘National IQ’ datasets do not provide accurate, unbiased or comparable measures of cognitive ability worldwide, PsyArXiv preprint. Author’s publication list confirms title and identifier. This is an additional methodological reading, not a genetic study of well maintenance. EHBEA’s history independently records the society’s 2020 national-IQ-data statement. ↩